| Metric | Global | Inside VSR zone | Outside VSR zone |
|---|---|---|---|
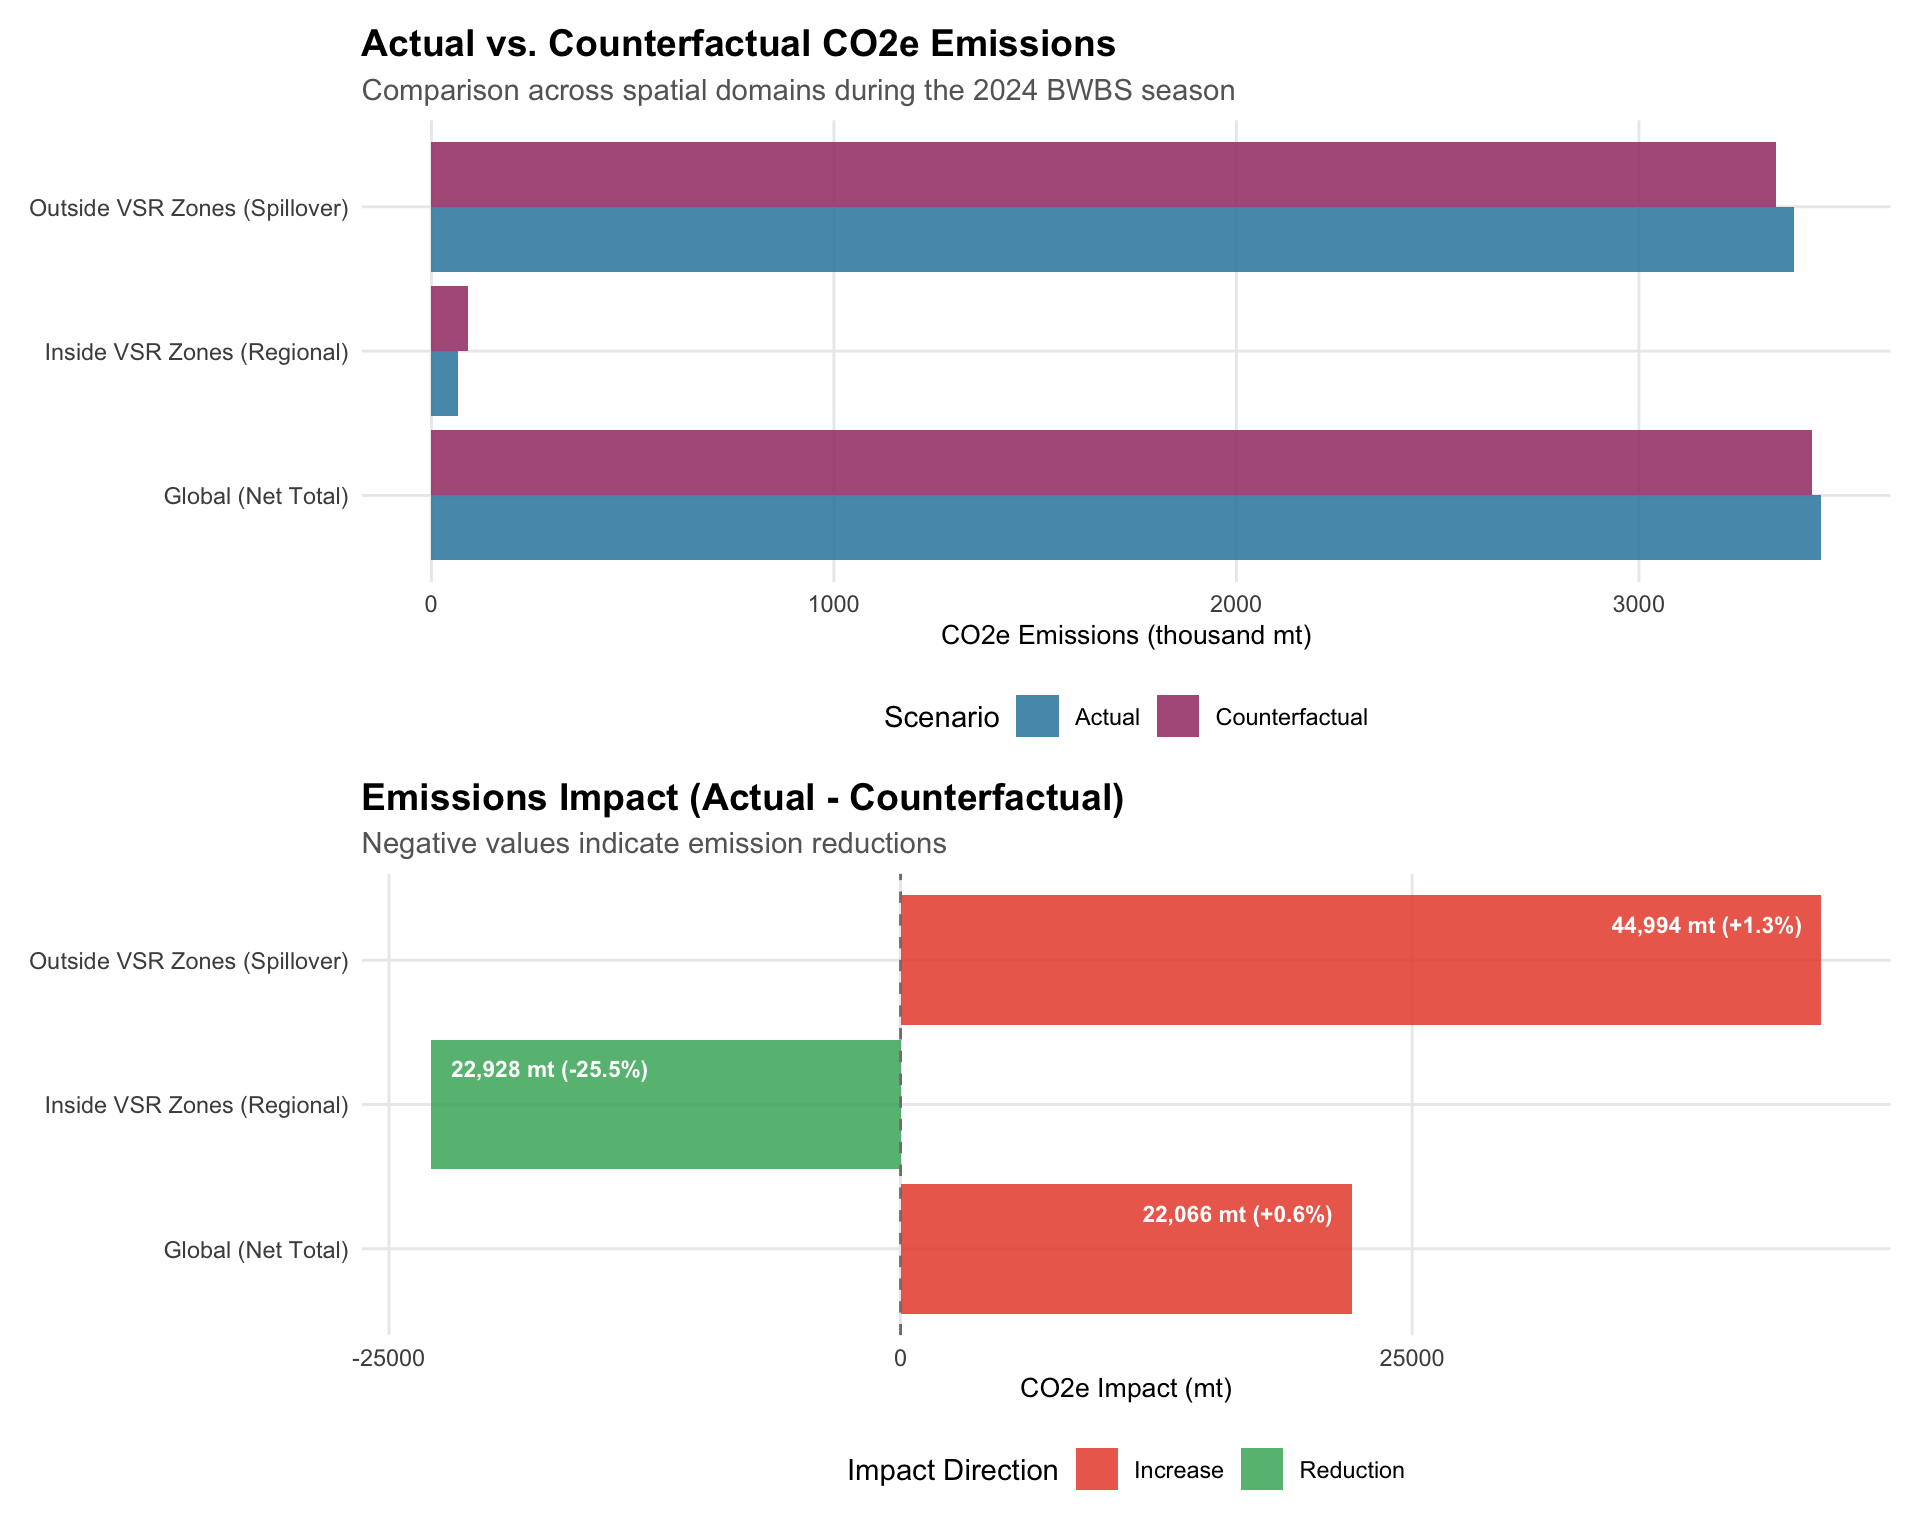
| Actual CO2e (mt) | 3,452,922 | 66,960 | 3,385,963 |
| Counterfactual CO2e (mt) | 3,430,856 | 89,887 | 3,340,969 |
| Net Impact CO2e (mt) | + 22,066 | -22,928 | + 44,994 |
| % Change | + 0.6% | -25.5% | + 1.3% |
3 Results
This section presents the results of our analysis examining the net global emissions impact of the 2024 VSR season. We analyze emissions at three spatial scales: global (entire trips), regional (inside VSR zones), and spillover (outside VSR zones). The results presented are based on the 243 vessels that fully comply with the program goals, defined as those that both: 1) traveled at an average speed of less than 10.4 knots inside the VSR zone during the VSR season; 2) and reduced their speed inside the VSR zone during the VSR season below the baseline speed at which they traveled outside the season (see Section 2.4).
3.1 Program Impact
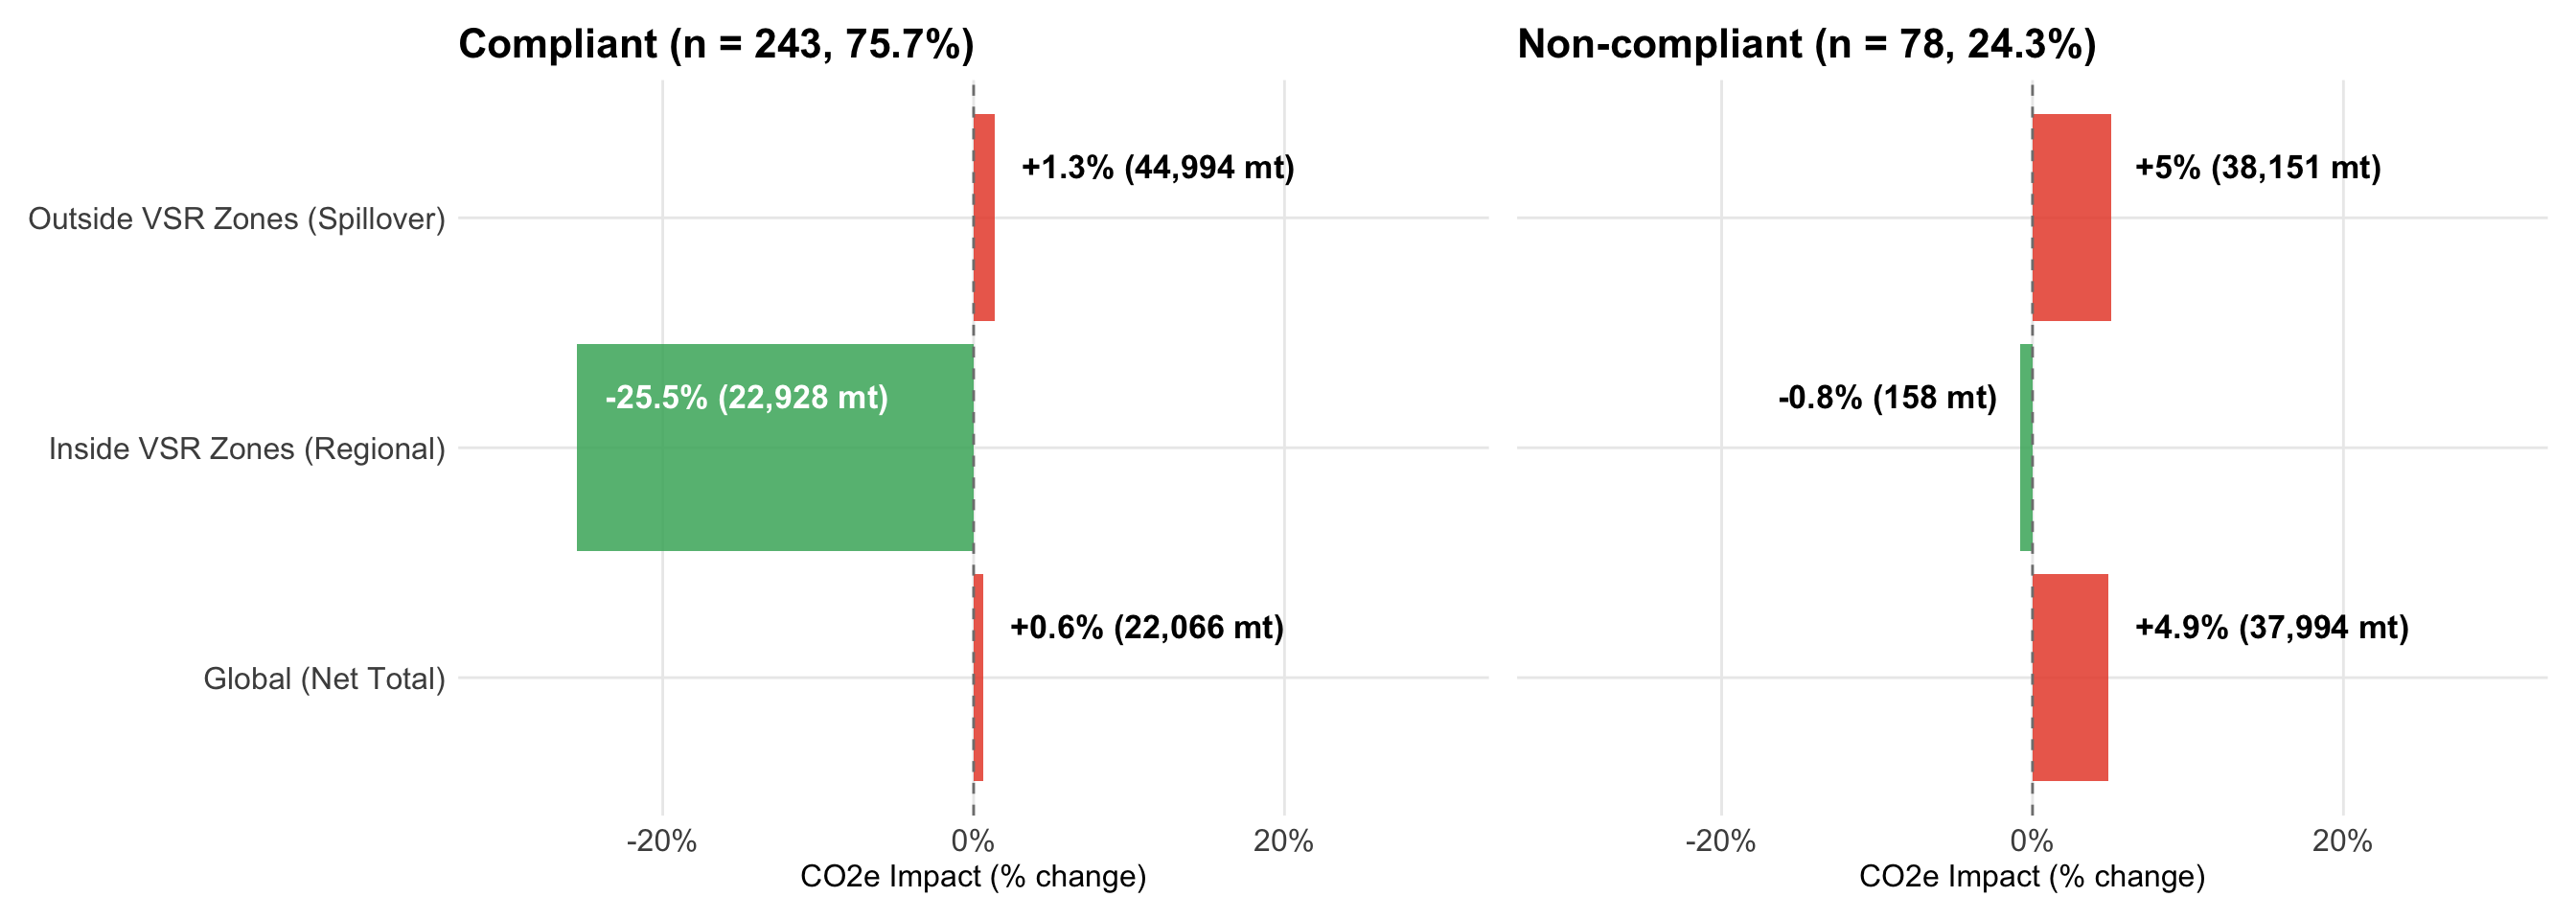
This analysis shows a net global increase of 22,066.08 mt of CO2e emissions. However, this corresponds to only a 0.6% increase relative to the counterfactual. The increase is driven by spillover occurring outside VSR zones, where emissions rise by 1.3%. Meanwhile, the program leads to a -25.5% reduction in emissions inside VSR zones (@tbl-program-summary, Figure 3.1).
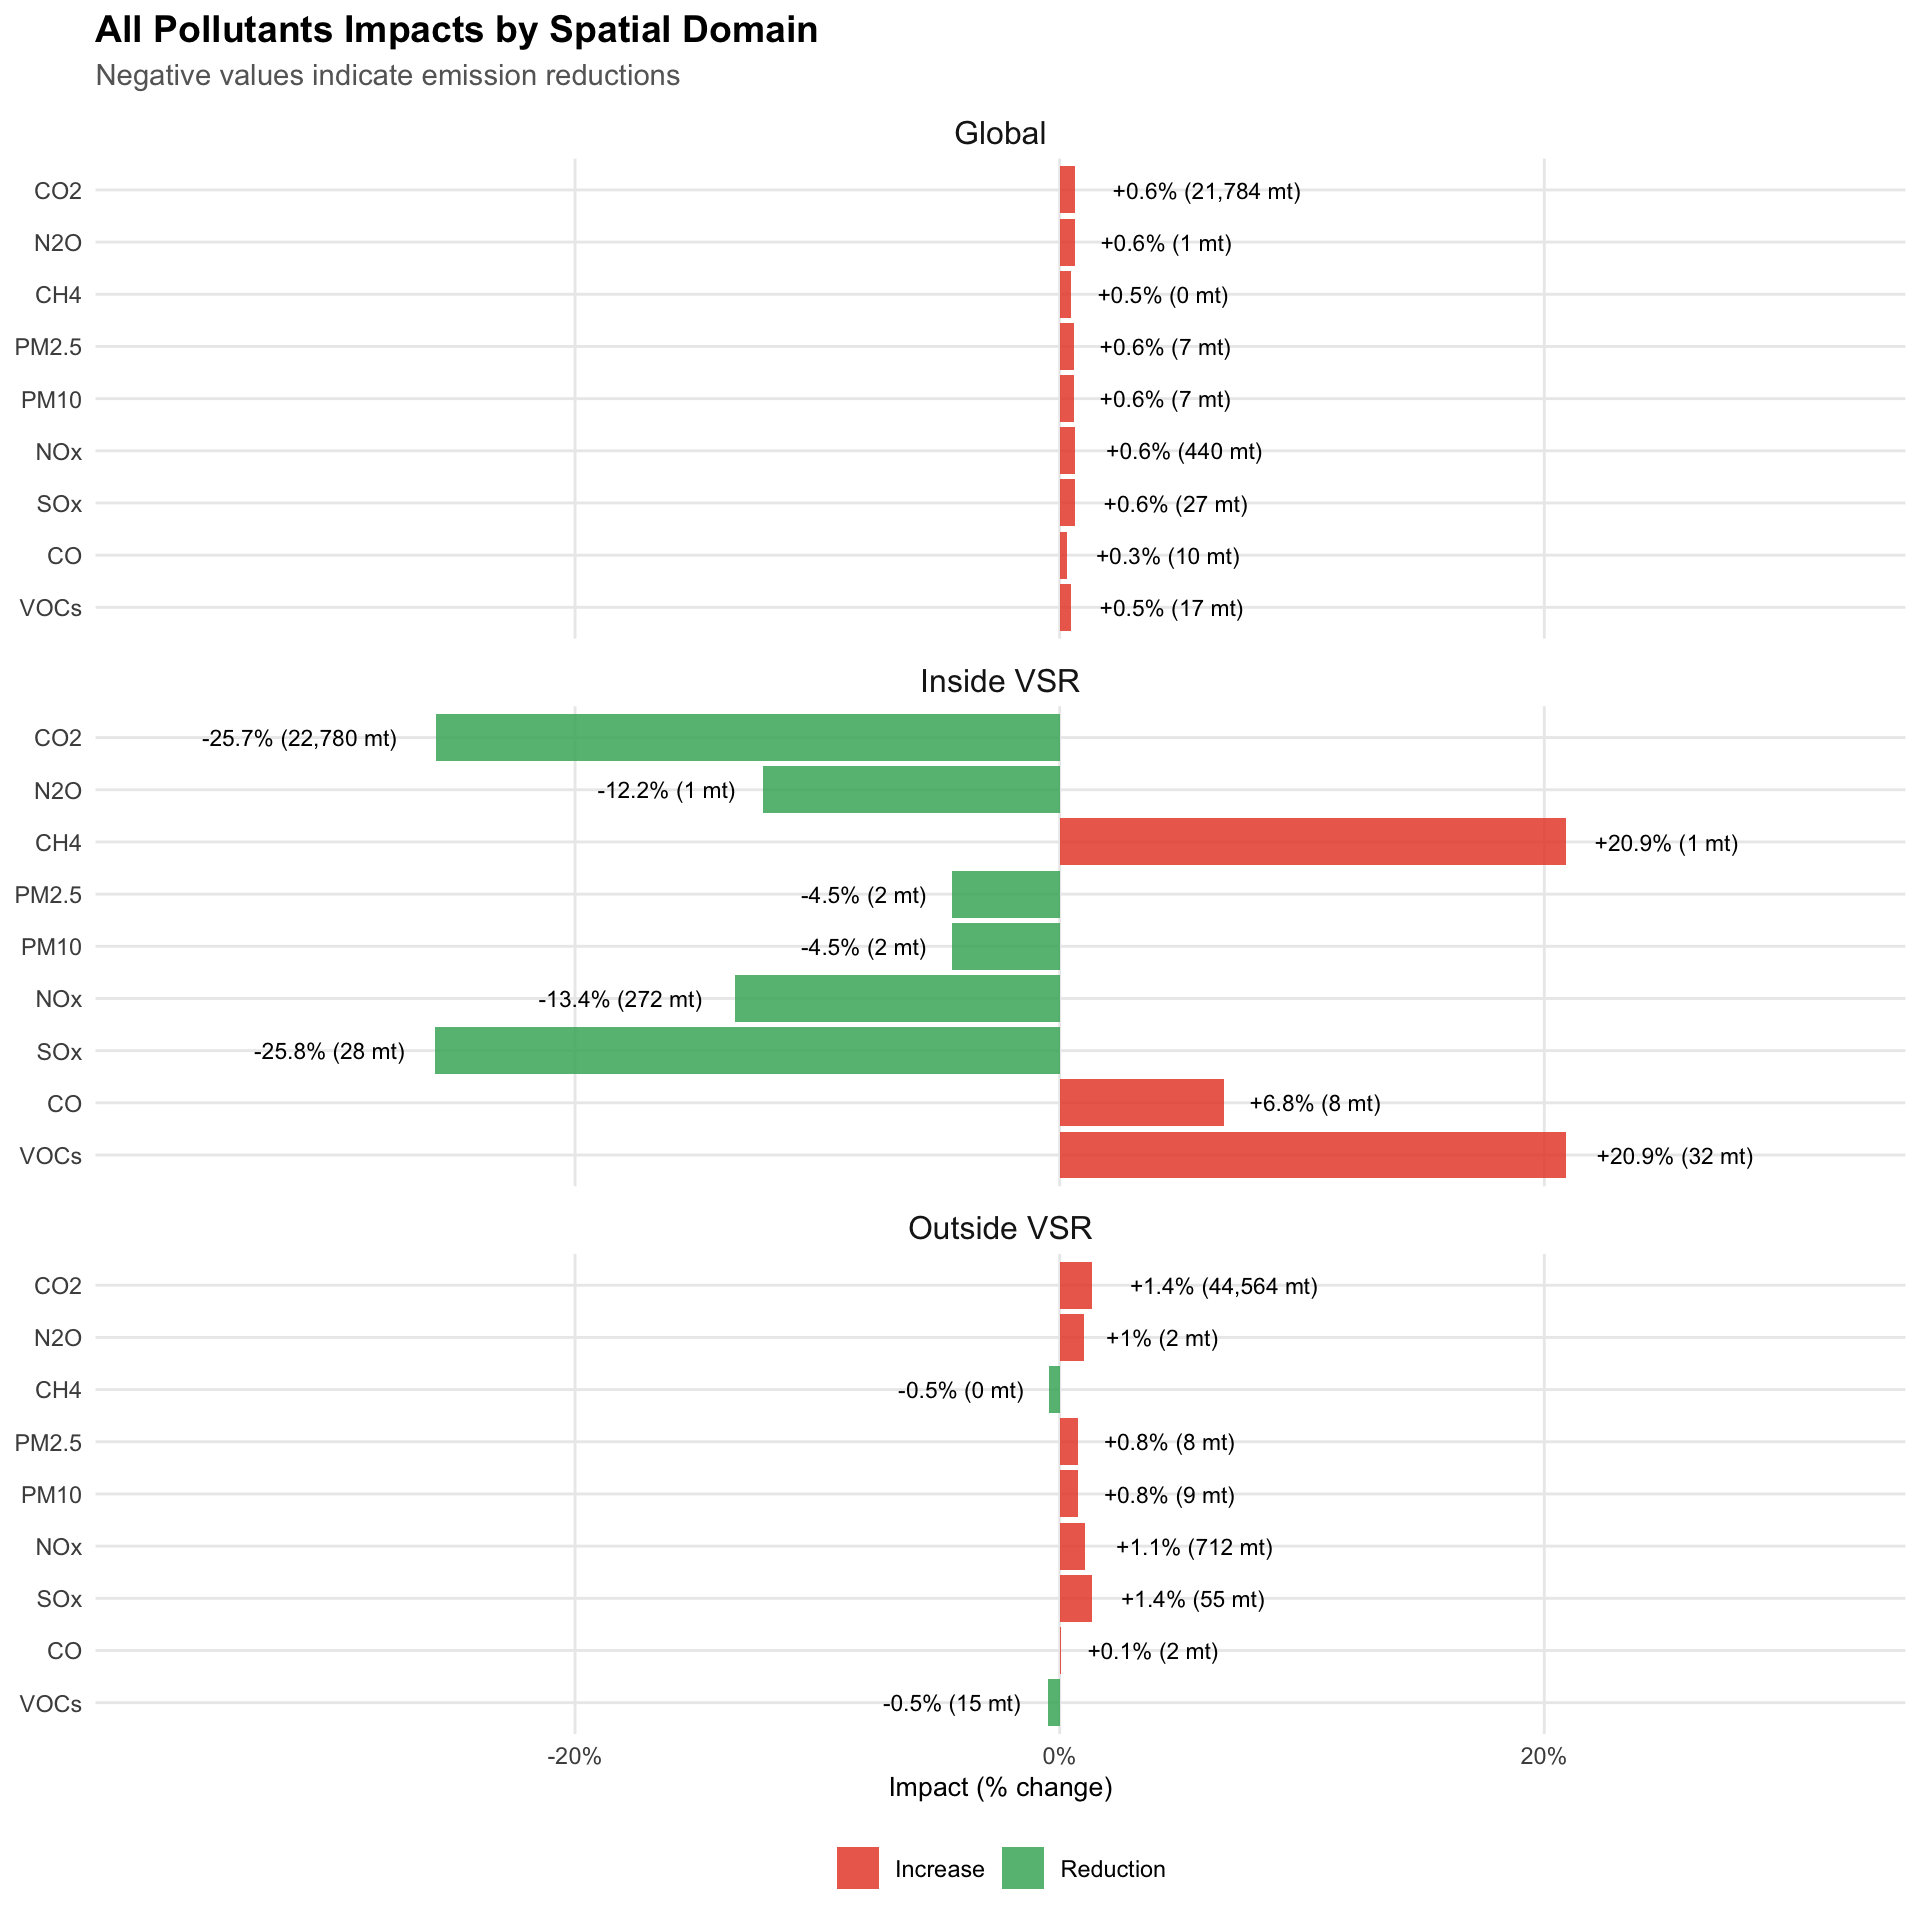
Net global increases are also observed for all other pollutants analyzed, although these remain small, at below 0.7%. Figure 3.2 further shows that the program achieves substantial reductions in local pollutants, with increases limited to CH4, CO, and VOCs. The increases in these three pollutants are consistent with a decrease in combustion efficiency at reduced speeds, as described in Chapter 4 and detailed in Appendix A regarding how our model captures these nonlinear combustion dynamics.
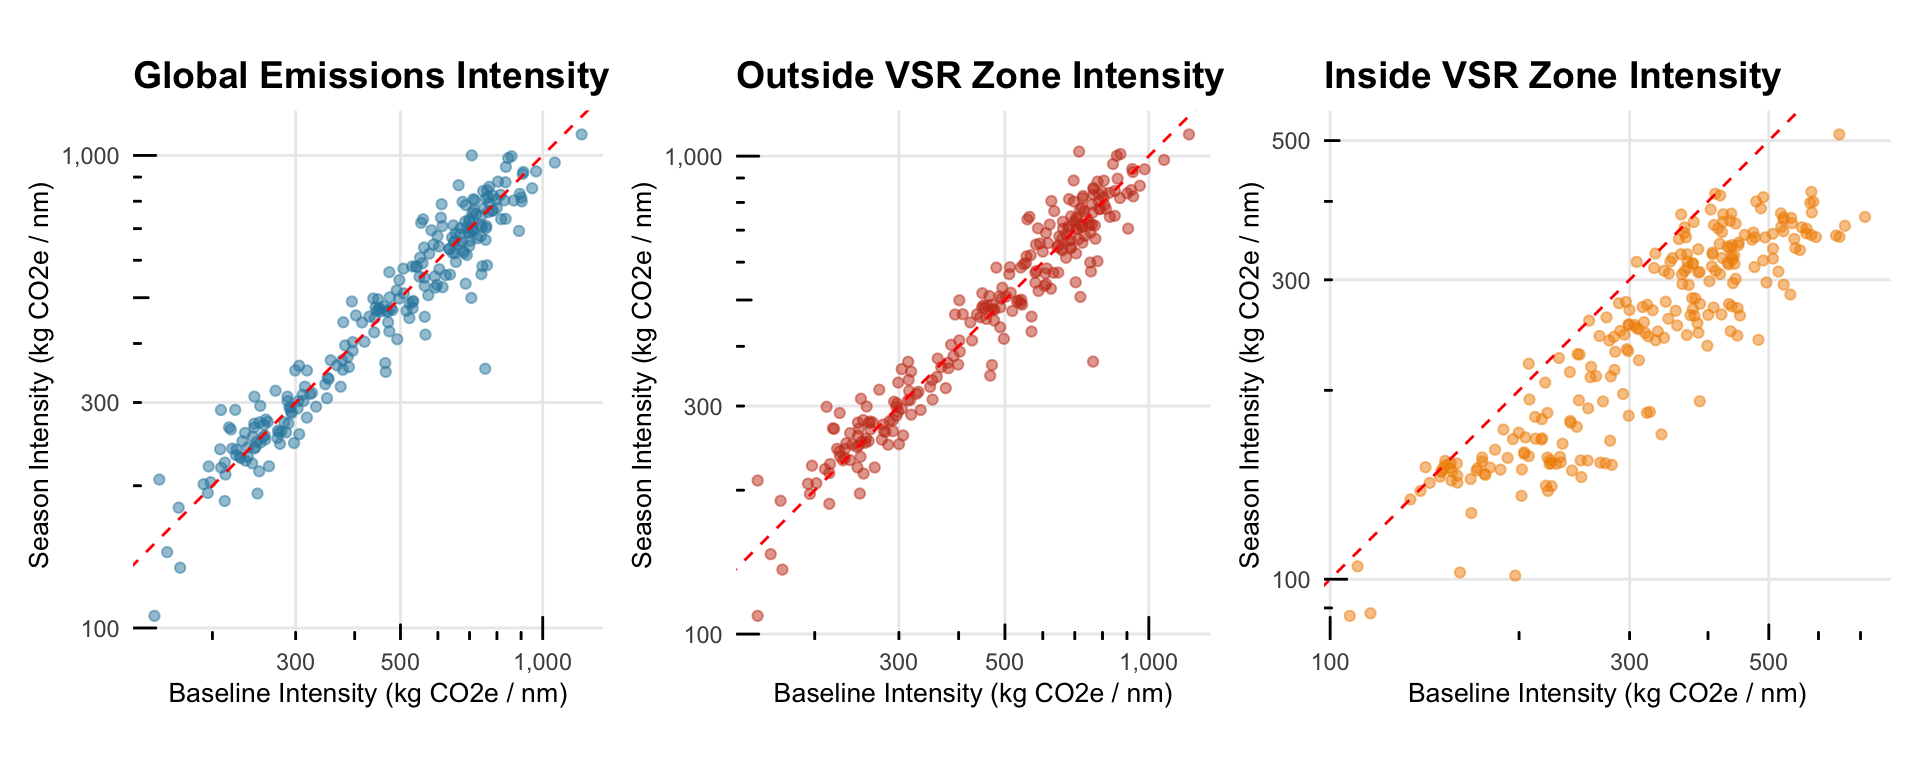
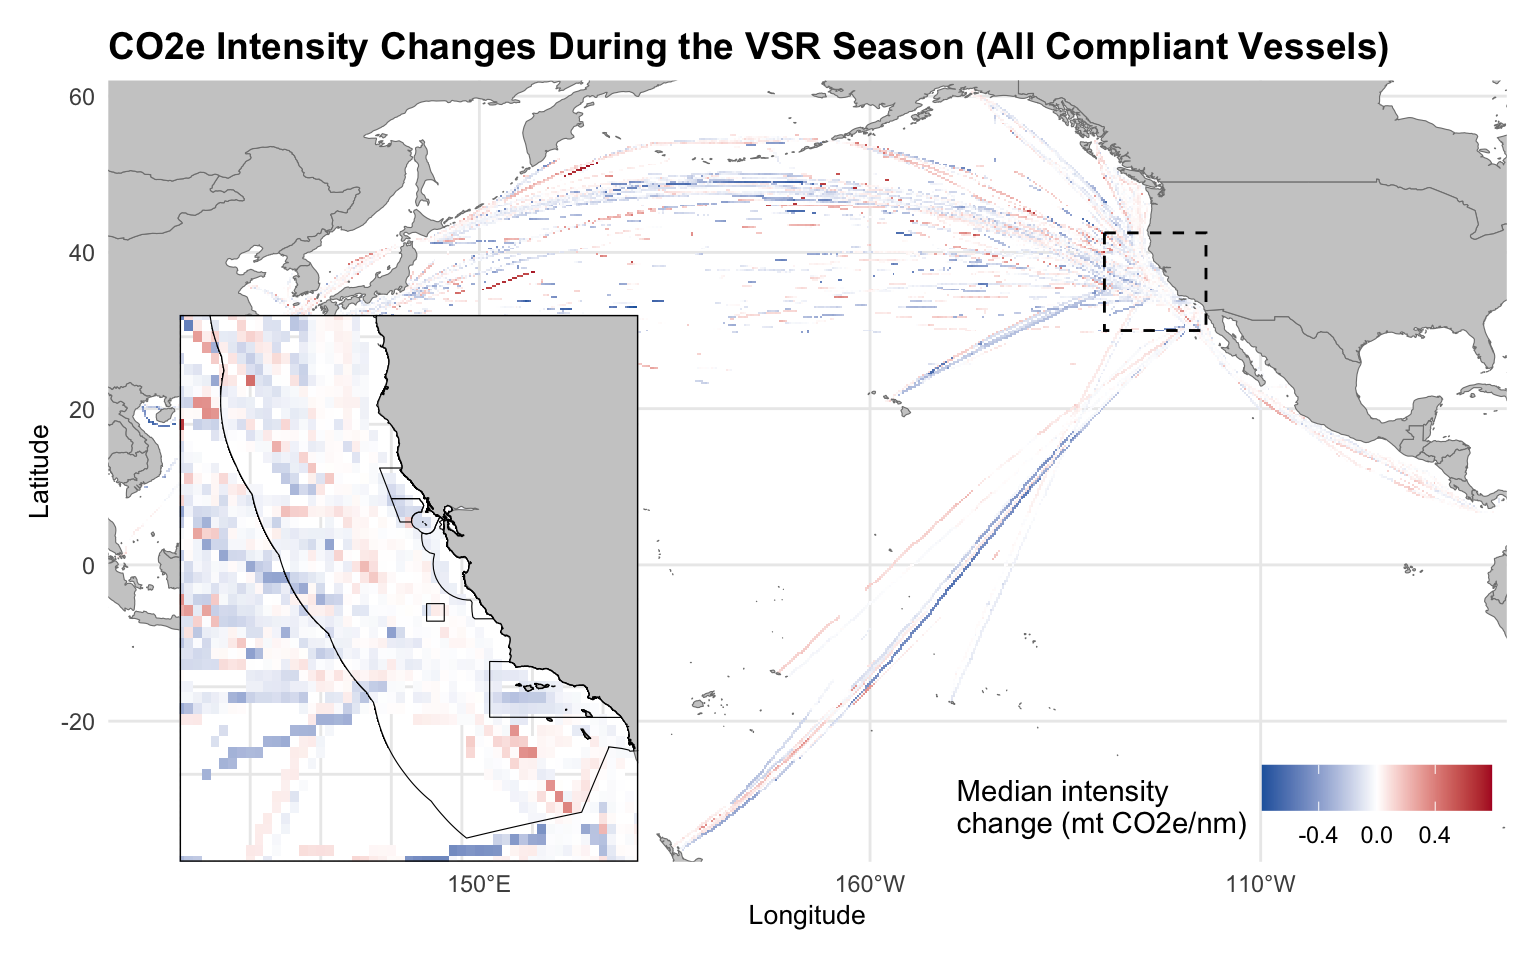
Substantial reductions in emissions inside the VSR zones are associated with changes in emissions intensity, with lower emission intensity observed during the within-season period (Figure 3.3). Since vessels travel relatively similar distances during the within-season and outside-season periods, reductions in emission intensity can be explained, as expected, by a reduction in speed during the season inside the VSR (Figure 3.4).
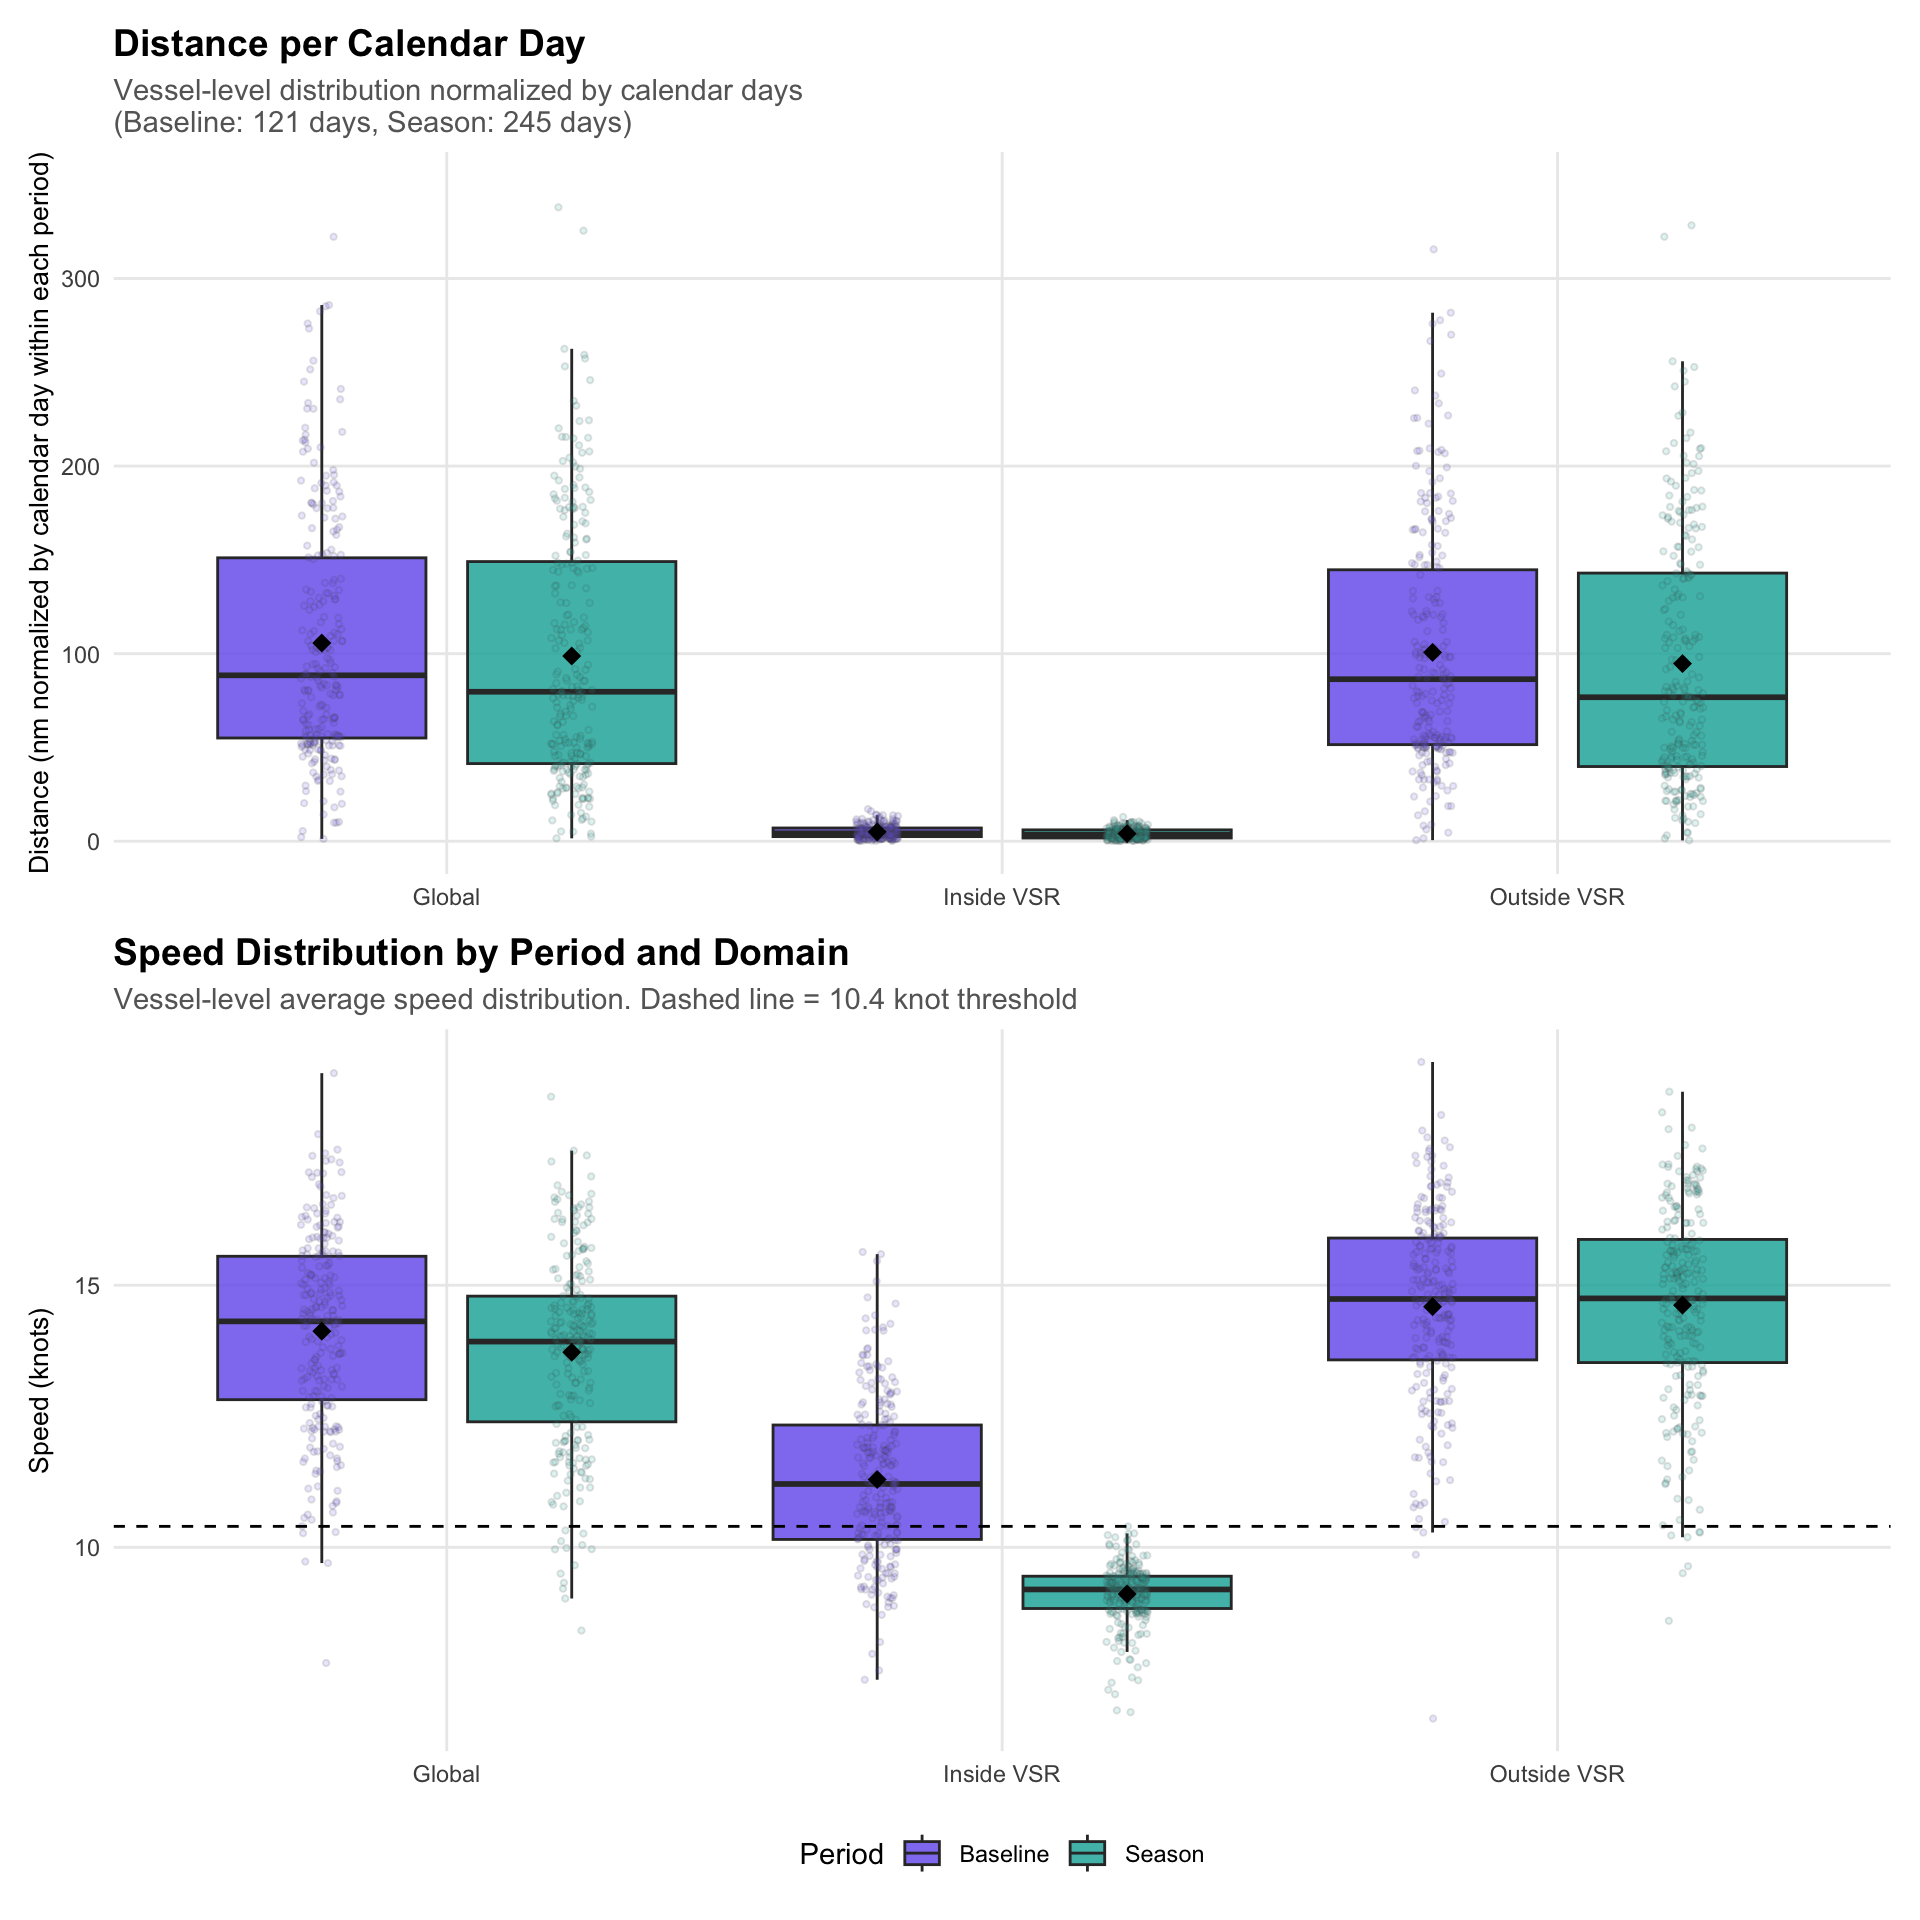
Despite no clear increase in average speeds outside VSR zones during the season, and in fact a slight decline in global average speeds from baseline levels (Figure 3.4), the reductions in speed within VSR zones and the associated emission reductions were offset by increased emissions elsewhere (Figure 3.1). Vessel-level analysis reveals that a subset of vessels drives this spillover effect, exhibiting increased emission impacts outside VSR zones. As shown in Figure 3.5, this pattern may reflect ‘catch-up’ behavior whereby vessels compensate for reduced speeds within VSR zones by increasing their speeds outside these areas.
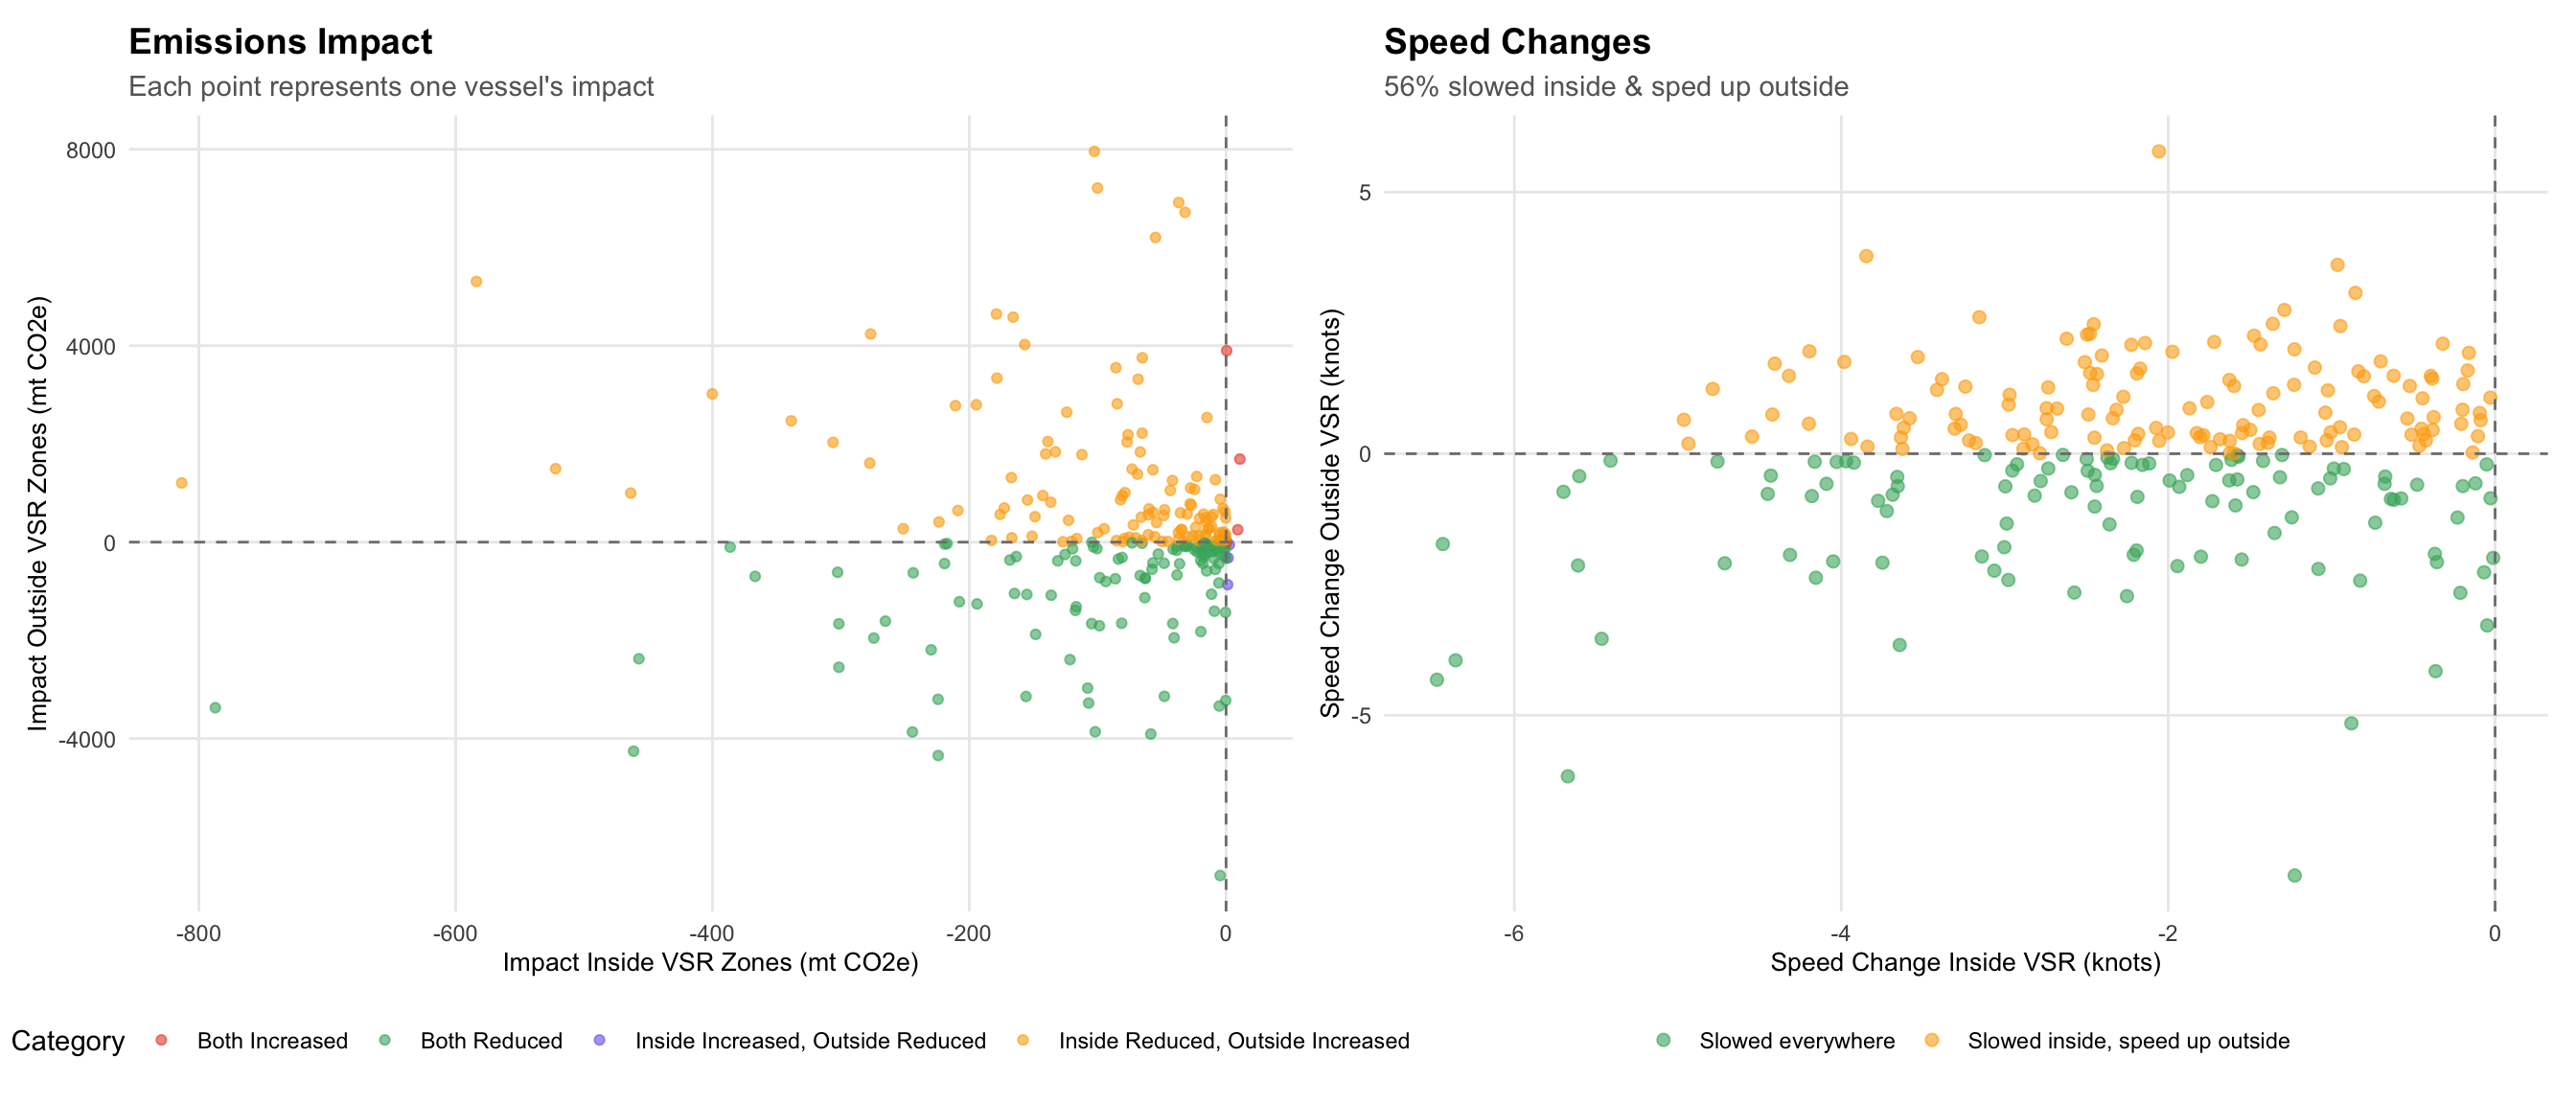
3.2 Vessels driving spillover
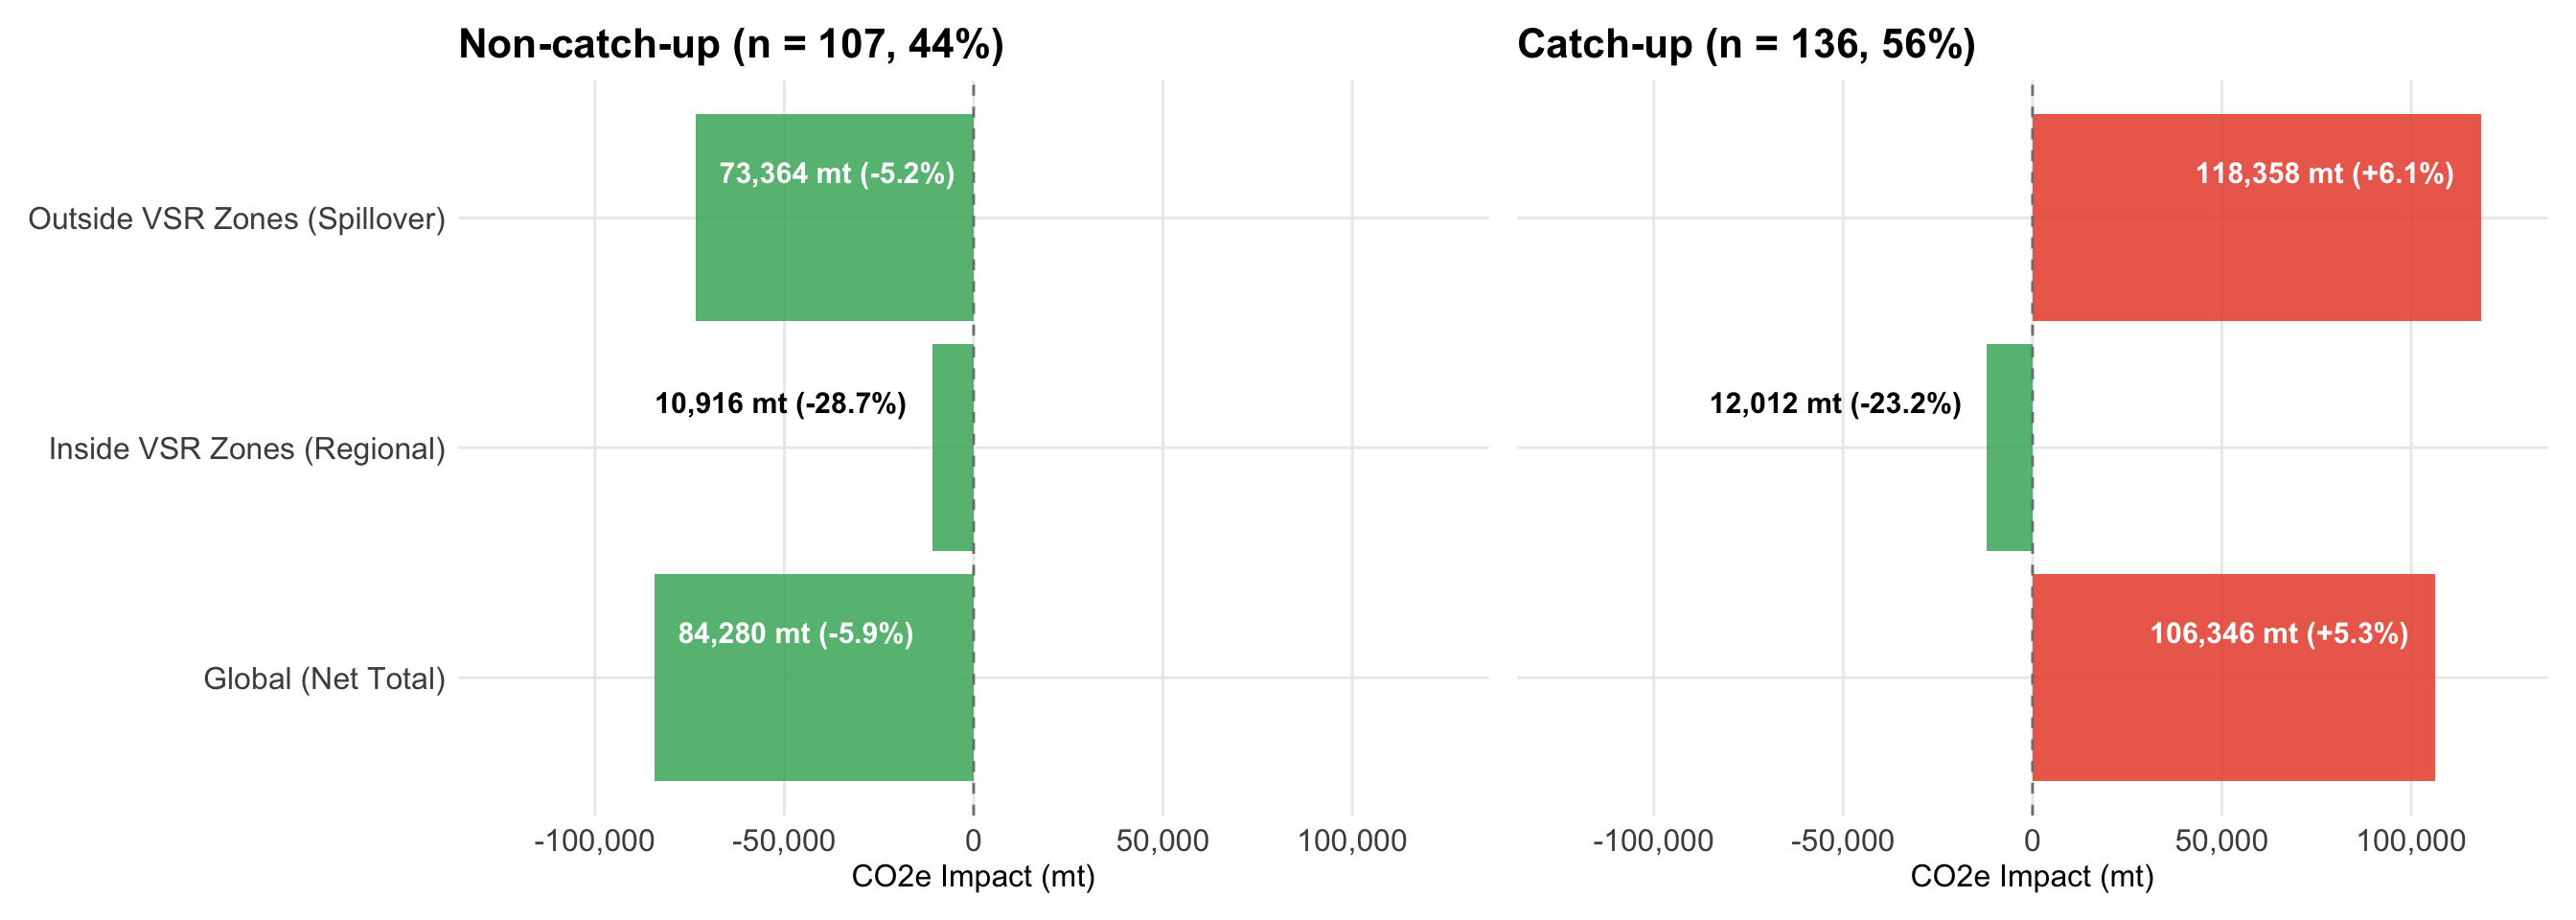
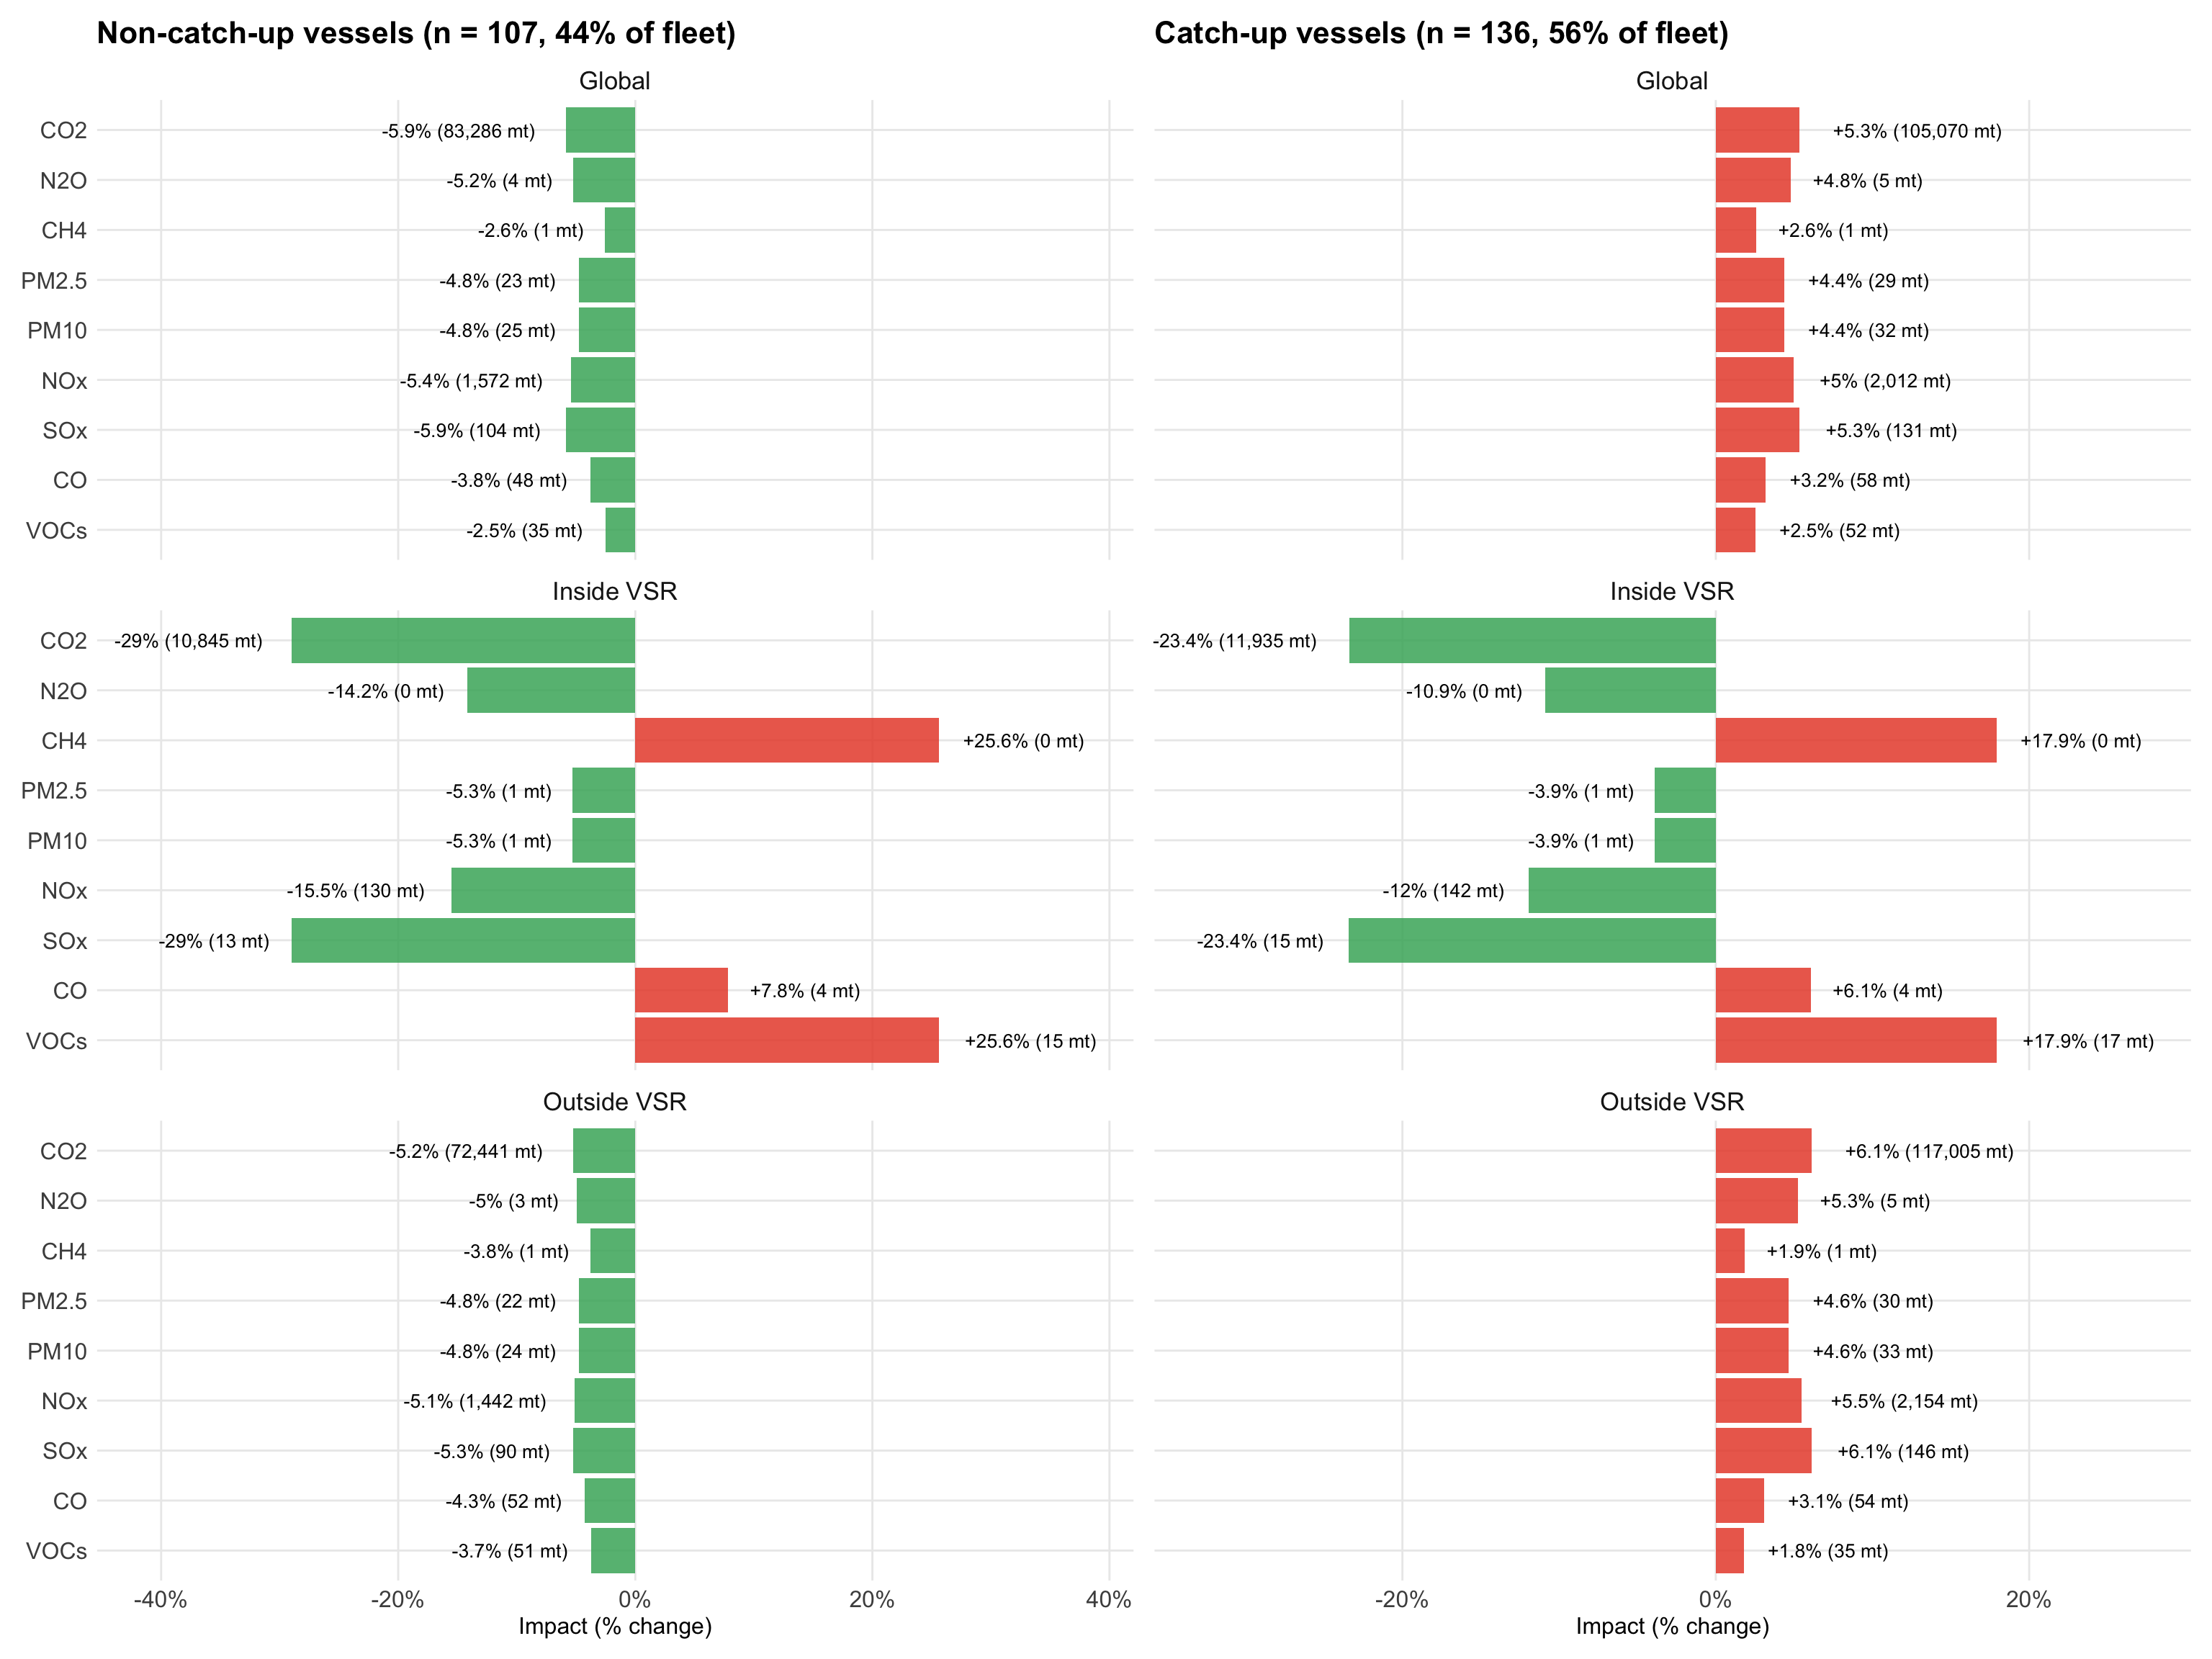
To better understand the spillover effect, we split the fleet into two groups based on their speed behavior: vessels that slowed inside VSR zones but sped up outside (“catch-up” vessels) and all other vessels. Figure 3.6 compares the CO2e emissions impact, while Figure 3.7 presents the multi-pollutant impacts for each group side by side. Together, these figures show clear evidence that catch-up vessels are driving the spillover effect.
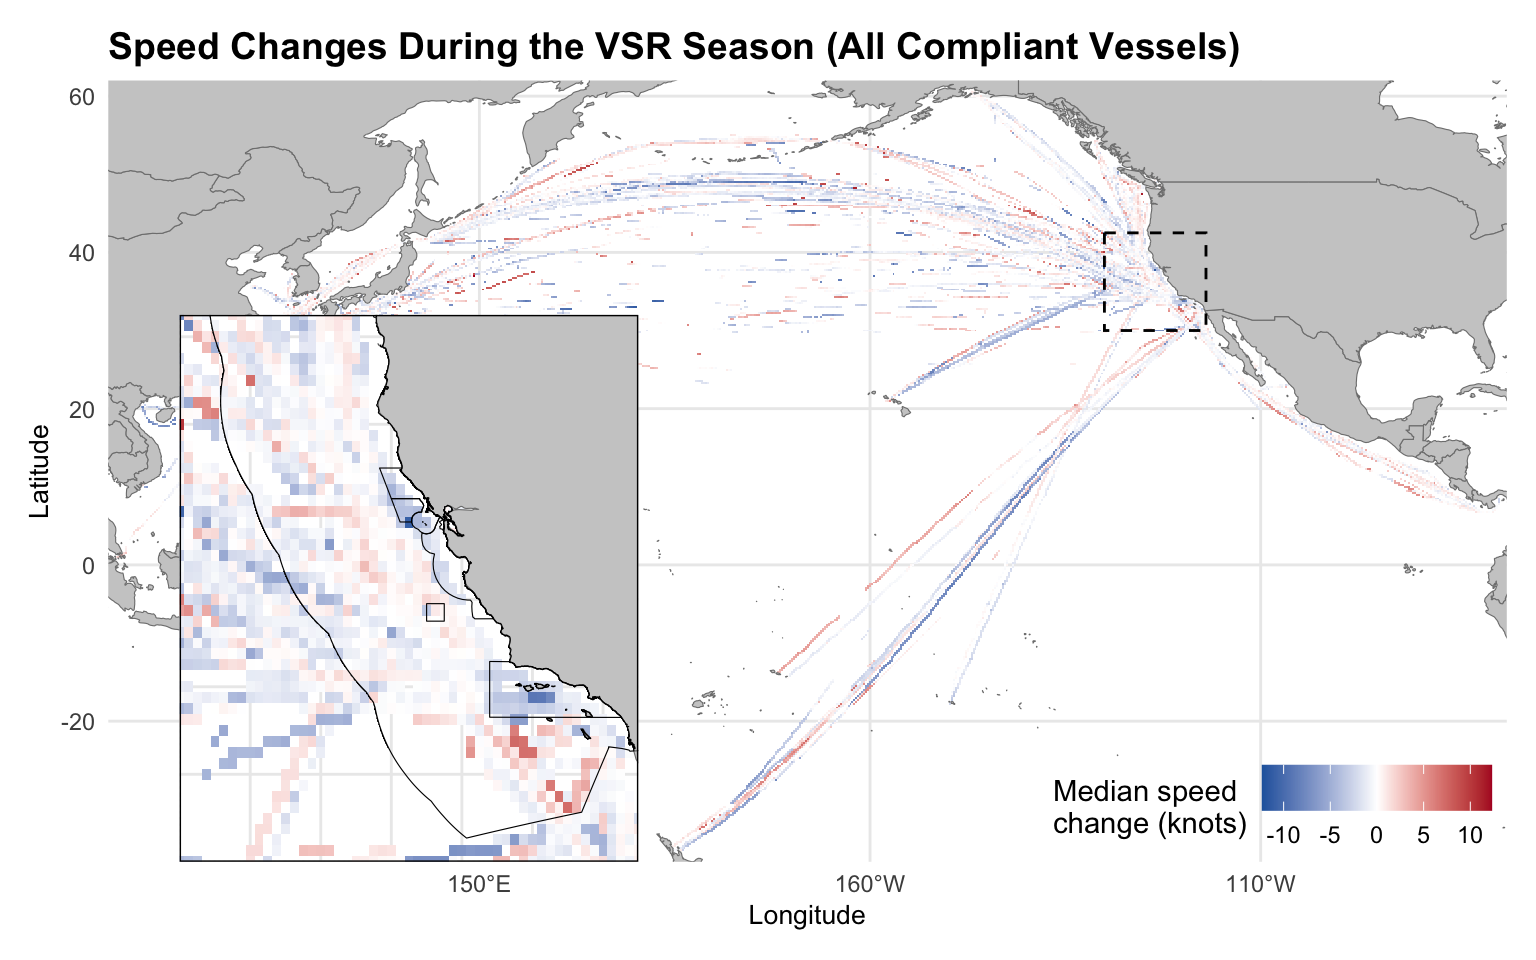
3.3 Spatial patterns of speed and emissions changes
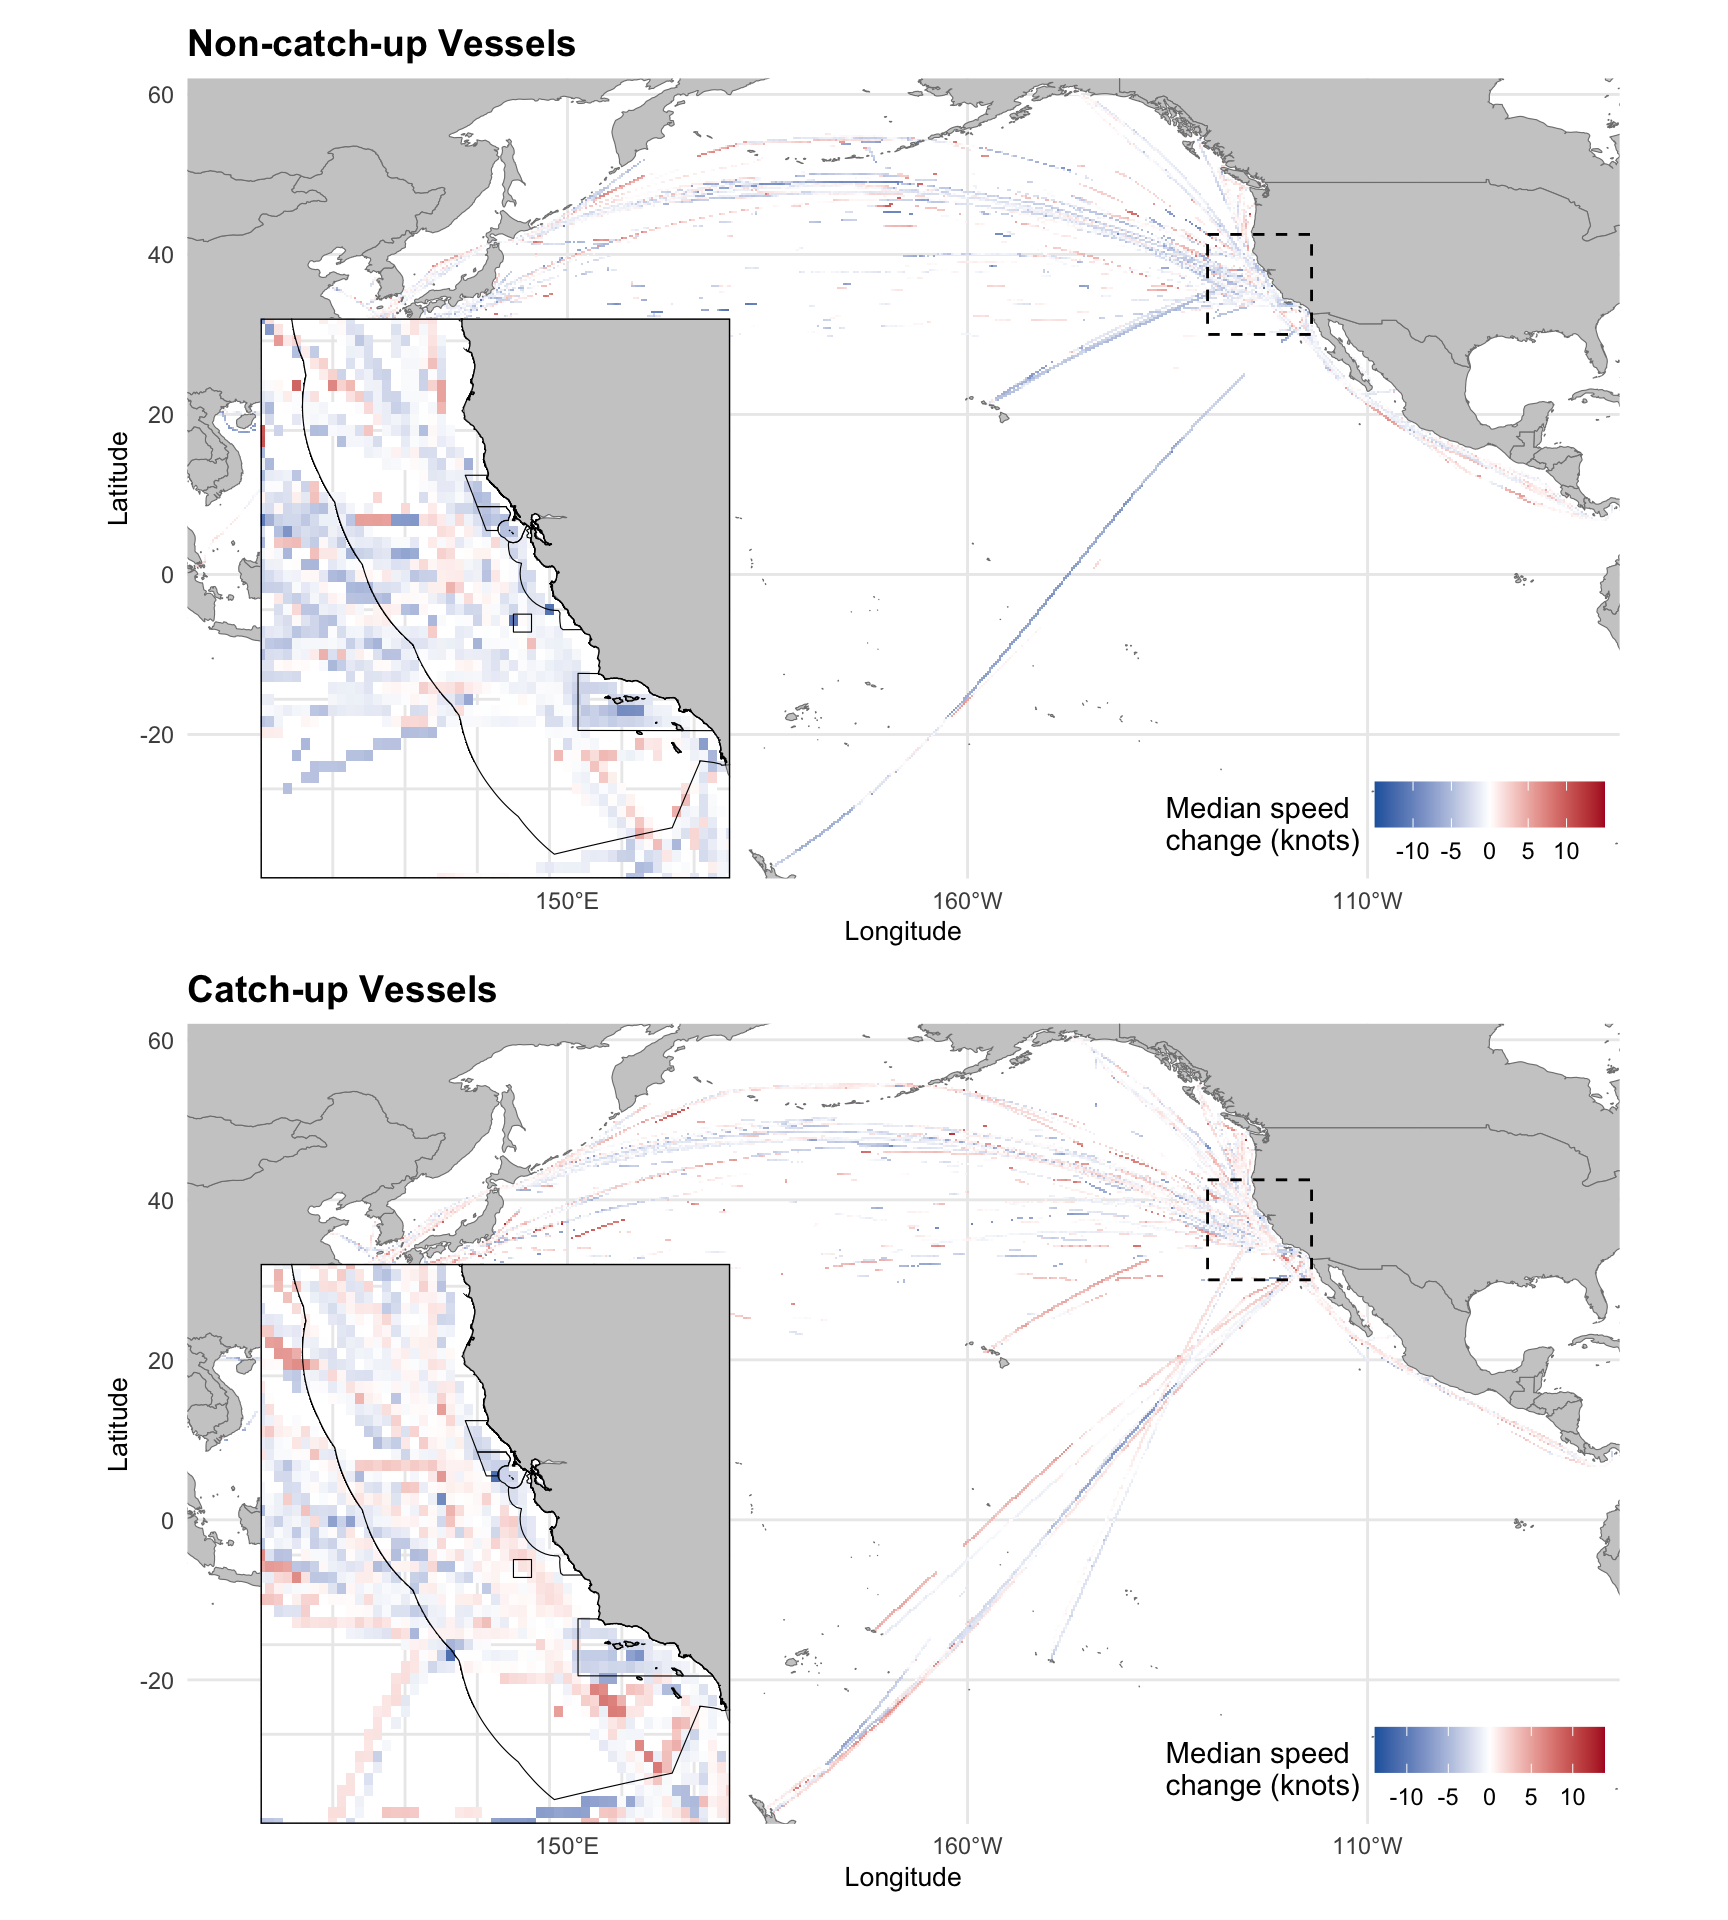
To visualize where speed and emissions changes occur geographically, we aggregate ping-level data for compliant vessels to a 0.25° × 0.25° grid. For each vessel and grid cell, we calculate aggregate speed (i.e., from total distance / total hours by vessel/pixel) and CO2e emissions intensity (i.e., from total CO2e / total distance by vessel/pixel) separately for trips during and outside the VSR season. We then compute the within-vessel difference (i.e., during season - outside season) and take the median across vessels for each grid cell. We present results for all compliant vessels, as well as separately for catch-up vessels (those that slowed inside VSR zones but sped up outside) and non-catch-up vessels.
Figure 3.8 and Figure 3.9 show mixed patterns in both speed and intensity. When representing across catch and non-catch vessels Figure 3.10 shows how most of the increases are associated with catch-up vessels.
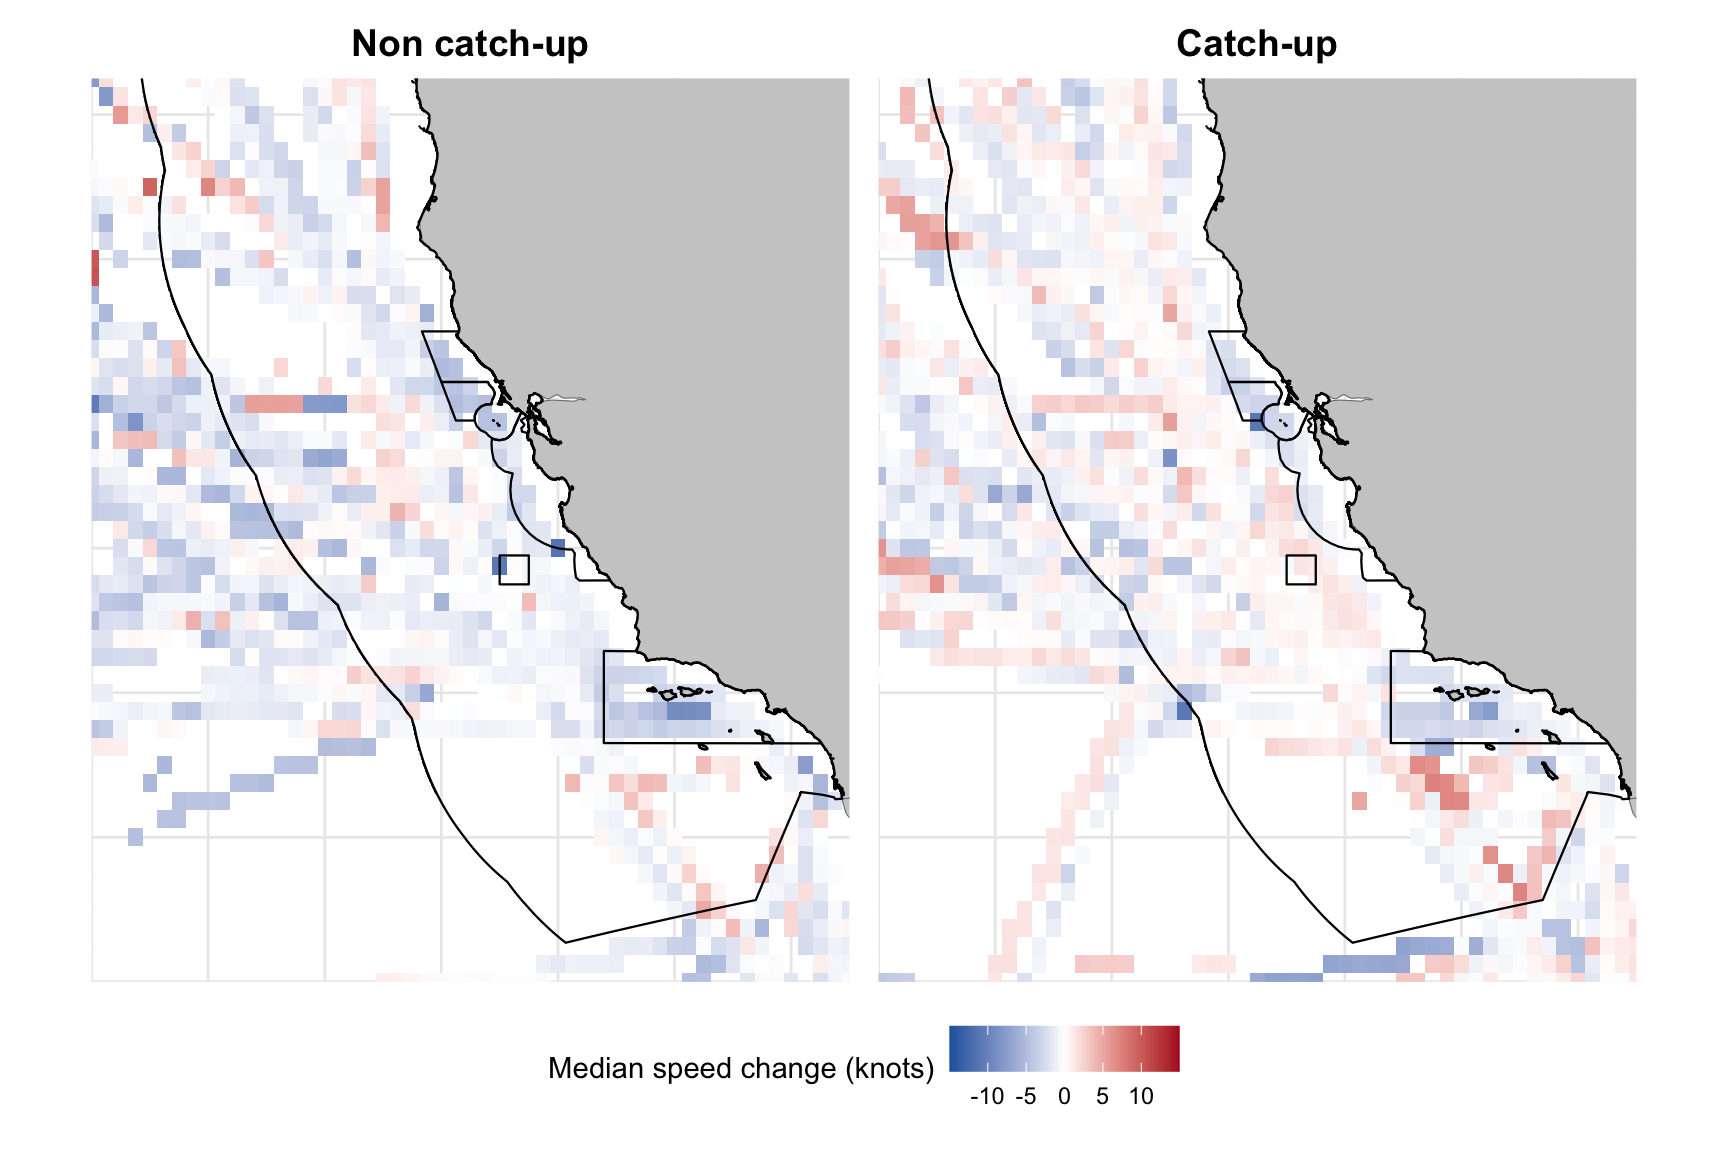
A closer look at activity within the West Coast EEZ shows that, while both groups of vessels reduce emissions inside the VSR, catch-up vessels account for a larger increase in speeds and intensities outside these areas, both within and beyond the EEZ (Table 3.2; Figure 3.11).
On average, non catch-up vessels show reductions in speed and intensity across all areas, despite some localized increases observed. In contrast, catch-up vessels exhibit average reductions only within VSR zones, with slight increases outside. In terms of spatial proximity to the VSR, this later group appears to increase speeds around the boundaries of the zones, particularly just outside the Southern California VSR zone, predominantly to the south of it, and in the area between the Northern and Southern California areas (Figure 3.11). In fact, catch-up vessels tend to concentrate these increases within the EEZ, compared to areas outside the EEZ (Table 3.2).
| Location | Grid cells | Mean speed change (kn) | Wtd. mean speed change (kn) | Mean intensity change (mt CO2e/nm) | Wtd. mean intensity change (mt CO2e/nm) |
|---|---|---|---|---|---|
| Non catch-up | |||||
| Inside VSR zone | 59 | -3.128 | -2.240 | -0.111006 | -0.078879 |
| Inside EEZ (excluding VSR) | 739 | -0.496 | -0.693 | -0.028465 | -0.031209 |
| Outside EEZ | 8833 | -1.091 | -0.973 | -0.072311 | -0.059352 |
| Catch-up | |||||
| Inside VSR zone | 58 | -2.100 | -1.818 | -0.070057 | -0.056812 |
| Inside EEZ (excluding VSR) | 937 | 0.111 | 0.199 | 0.005315 | 0.008295 |
| Outside EEZ | 11146 | -0.009 | 0.069 | -0.008630 | -0.000045 |
3.4 Compliant vs. non-compliant vessels
As an additional comparison, we next look at how the BWBS season impacted CO2e emissions from non-compliant vessels, and compare these impacts to those from compliant vessels. Figure 3.12 shows the relative (%) emissions impact for each group of vessels and each of the three spatial domains (inside VSR zones, outside VSR zones, and global). The left panel is simply the same as the bottom panel from Figure 3.1; the right panel shows similar information, but for non-compliant vessels. This indicates that even for non-compliant vessels, there is an adjustment in activity outside the VSR zones between during and outside the season, which could reflect a background variability between the baseline and the season that is not fully captured in the current analysis. This information helps contextualize the observed net global emissions increases of the compliant fleet. This suggests that some level of spillover may occur even in the absence of full behavioral adjustment, and that spillover is even higher for non-compliant vessels. This indicates that the program may still yield a net benefit in terms of net global impact once this background effect is accounted for. Future work aimed at producing a robust causal inference assessment of the program may be able to account for this background level of adjustment.
3.5 Company level results
We can explore which companies accounted for most of the program benefits in terms of global emissions reductions and reductions within the VSR zones, as well as which contributed to emissions spillover. Table 3.3 shows, for each company, the participating vessels that were matched to those available in our dataset and that had activity in both periods and both inside and outside the VSR, allowing baseline and counterfactual scenarios to be constructed. Among these, the table details which vessels were compliant (i.e., navigated below 10.4 knots within the VSR during the season and reduced their speed relative to baseline) and which were non-compliant. Percentage values in brackets represent each group’s share of the vessels included in the analysis. The table also reports how many compliant vessels per company exhibited non–catch-up behavior (i.e., did not increase speed outside the VSR) versus catch-up behavior (i.e., increased speed outside the VSR, contributing to spillover). Companies are sorted by the highest percentage of compliant vessels among those included in the analysis.
| Company | Listed | Matched | Non-compl. | Compliant | Non-catch-up | Catch-up |
|---|---|---|---|---|---|---|
| COSCO | 24 | 15 | 0 | 15 (100%) | 3 (20%) | 12 (80%) |
| Dockendale | 8 | 4 | 0 | 4 (100%) | 2 (50%) | 2 (50%) |
| Marathon Petroleum | 7 | 6 | 0 | 6 (100%) | 3 (50%) | 3 (50%) |
| OOCL | 15 | 8 | 0 | 8 (100%) | 3 (37.5%) | 5 (62.5%) |
| Polar Tankers | 5 | 5 | 0 | 5 (100%) | 1 (20%) | 4 (80%) |
| Scorpio Group | 16 | 2 | 0 | 2 (100%) | 2 (100%) | 0 |
| Swire Shipping | 3 | 2 | 0 | 2 (100%) | 0 | 2 (100%) |
| Temm Maritime Co Ltd | 1 | 1 | 0 | 1 (100%) | 1 (100%) | 0 |
| Toyofuji | 1 | 1 | 0 | 1 (100%) | 0 | 1 (100%) |
| Wallenius | 37 | 7 | 0 | 7 (100%) | 2 (28.6%) | 5 (71.4%) |
| ONE | 52 | 36 | 3 (8.3%) | 33 (91.7%) | 12 (36.4%) | 21 (63.6%) |
| Maersk | 30 | 26 | 3 (11.5%) | 23 (88.5%) | 9 (39.1%) | 14 (60.9%) |
| CMA CGM | 70 | 34 | 5 (14.7%) | 29 (85.3%) | 17 (58.6%) | 12 (41.4%) |
| OSG Ship Management, Inc. | 8 | 6 | 1 (16.7%) | 5 (83.3%) | 3 (60%) | 2 (40%) |
| Wan Hai | 17 | 6 | 1 (16.7%) | 5 (83.3%) | 1 (20%) | 4 (80%) |
| Hyundai Glovis | 40 | 16 | 3 (18.8%) | 13 (81.2%) | 10 (76.9%) | 3 (23.1%) |
| Yang Ming | 24 | 17 | 5 (29.4%) | 12 (70.6%) | 5 (41.7%) | 7 (58.3%) |
| MSC | 69 | 25 | 8 (32%) | 17 (68%) | 6 (35.3%) | 11 (64.7%) |
| D'Amico Group | 6 | 3 | 1 (33.3%) | 2 (66.7%) | 1 (50%) | 1 (50%) |
| Hyundai (UCC) | 21 | 6 | 2 (33.3%) | 4 (66.7%) | 4 (100%) | 0 |
| Pacbasin | 30 | 3 | 1 (33.3%) | 2 (66.7%) | 2 (100%) | 0 |
| NYK-RoRo | 67 | 29 | 10 (34.5%) | 19 (65.5%) | 10 (52.6%) | 9 (47.4%) |
| Mol ACE | 33 | 15 | 6 (40%) | 9 (60%) | 5 (55.6%) | 4 (44.4%) |
| Evergreen | 31 | 13 | 6 (46.2%) | 7 (53.8%) | 3 (42.9%) | 4 (57.1%) |
| K Line | 57 | 22 | 11 (50%) | 11 (50%) | 2 (18.2%) | 9 (81.8%) |
| Swire Bulk | 12 | 3 | 2 (66.7%) | 1 (33.3%) | 0 | 1 (100%) |
| Anglo-Eastern Shipmanagement | 16 | 2 | 2 (100%) | 0 | 0 | 0 |
| Cetus Maritime (Shanghai) Ltd. | 3 | 1 | 1 (100%) | 0 | 0 | 0 |
| HMC Shipmanagement Co Ltd | 5 | 1 | 1 (100%) | 0 | 0 | 0 |
| Hapag-Lloyd | 9 | 2 | 2 (100%) | 0 | 0 | 0 |
| Pasha Hawaii | 5 | 3 | 3 (100%) | 0 | 0 | 0 |
| Unisea Shipping Ltd | 3 | 1 | 1 (100%) | 0 | 0 | 0 |
| Other (unmatched vessels) | 32 | 0 | 0 | 0 | 0 | 0 |
| Total | 757 | 321 | 78 (24.3%) | 243 (75.7%) | 107 (44%) | 136 (56%) |
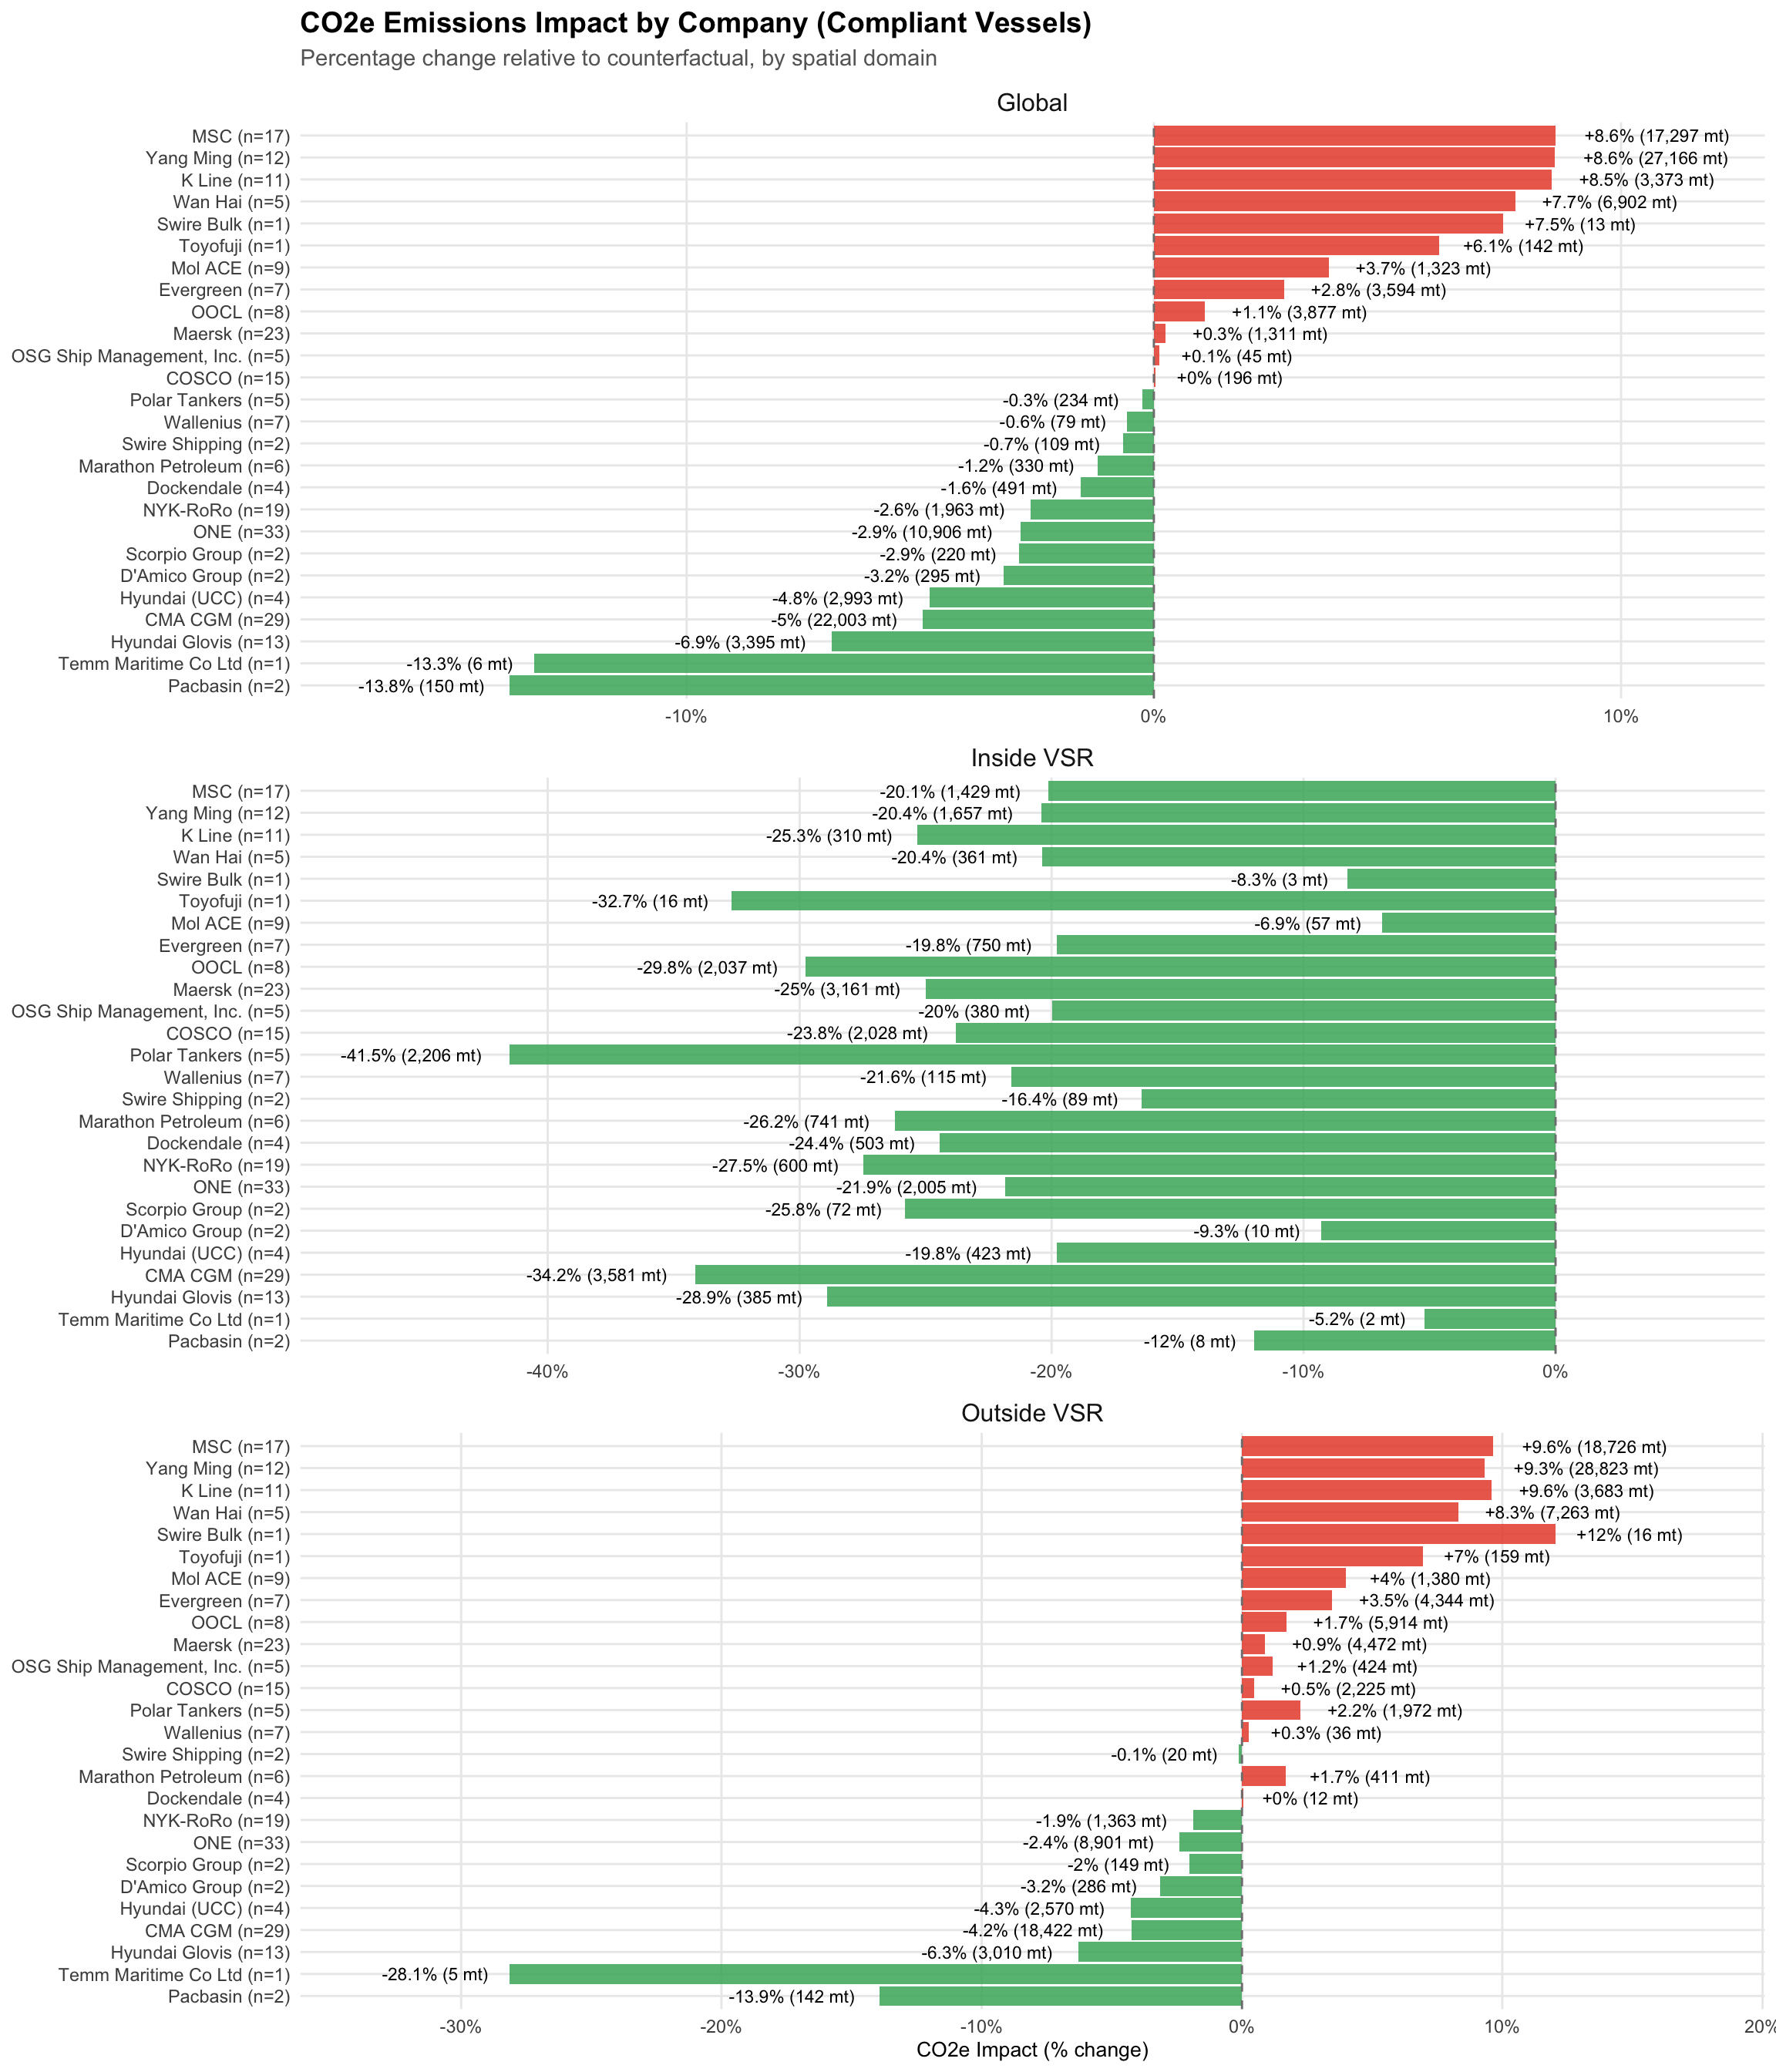
Figure 3.13 shows, for each company, the contribution of compliant vessels to emissions changes across the different spatial domains. This reveals a generalized decrease in emissions within VSR zones and shows that, for many companies, compliant vessels contributed to a net global reduction in emissions relative to their baseline. Fewer than half of the companies exhibit spillover effects driven by vessels engaging in catch-up behavior.
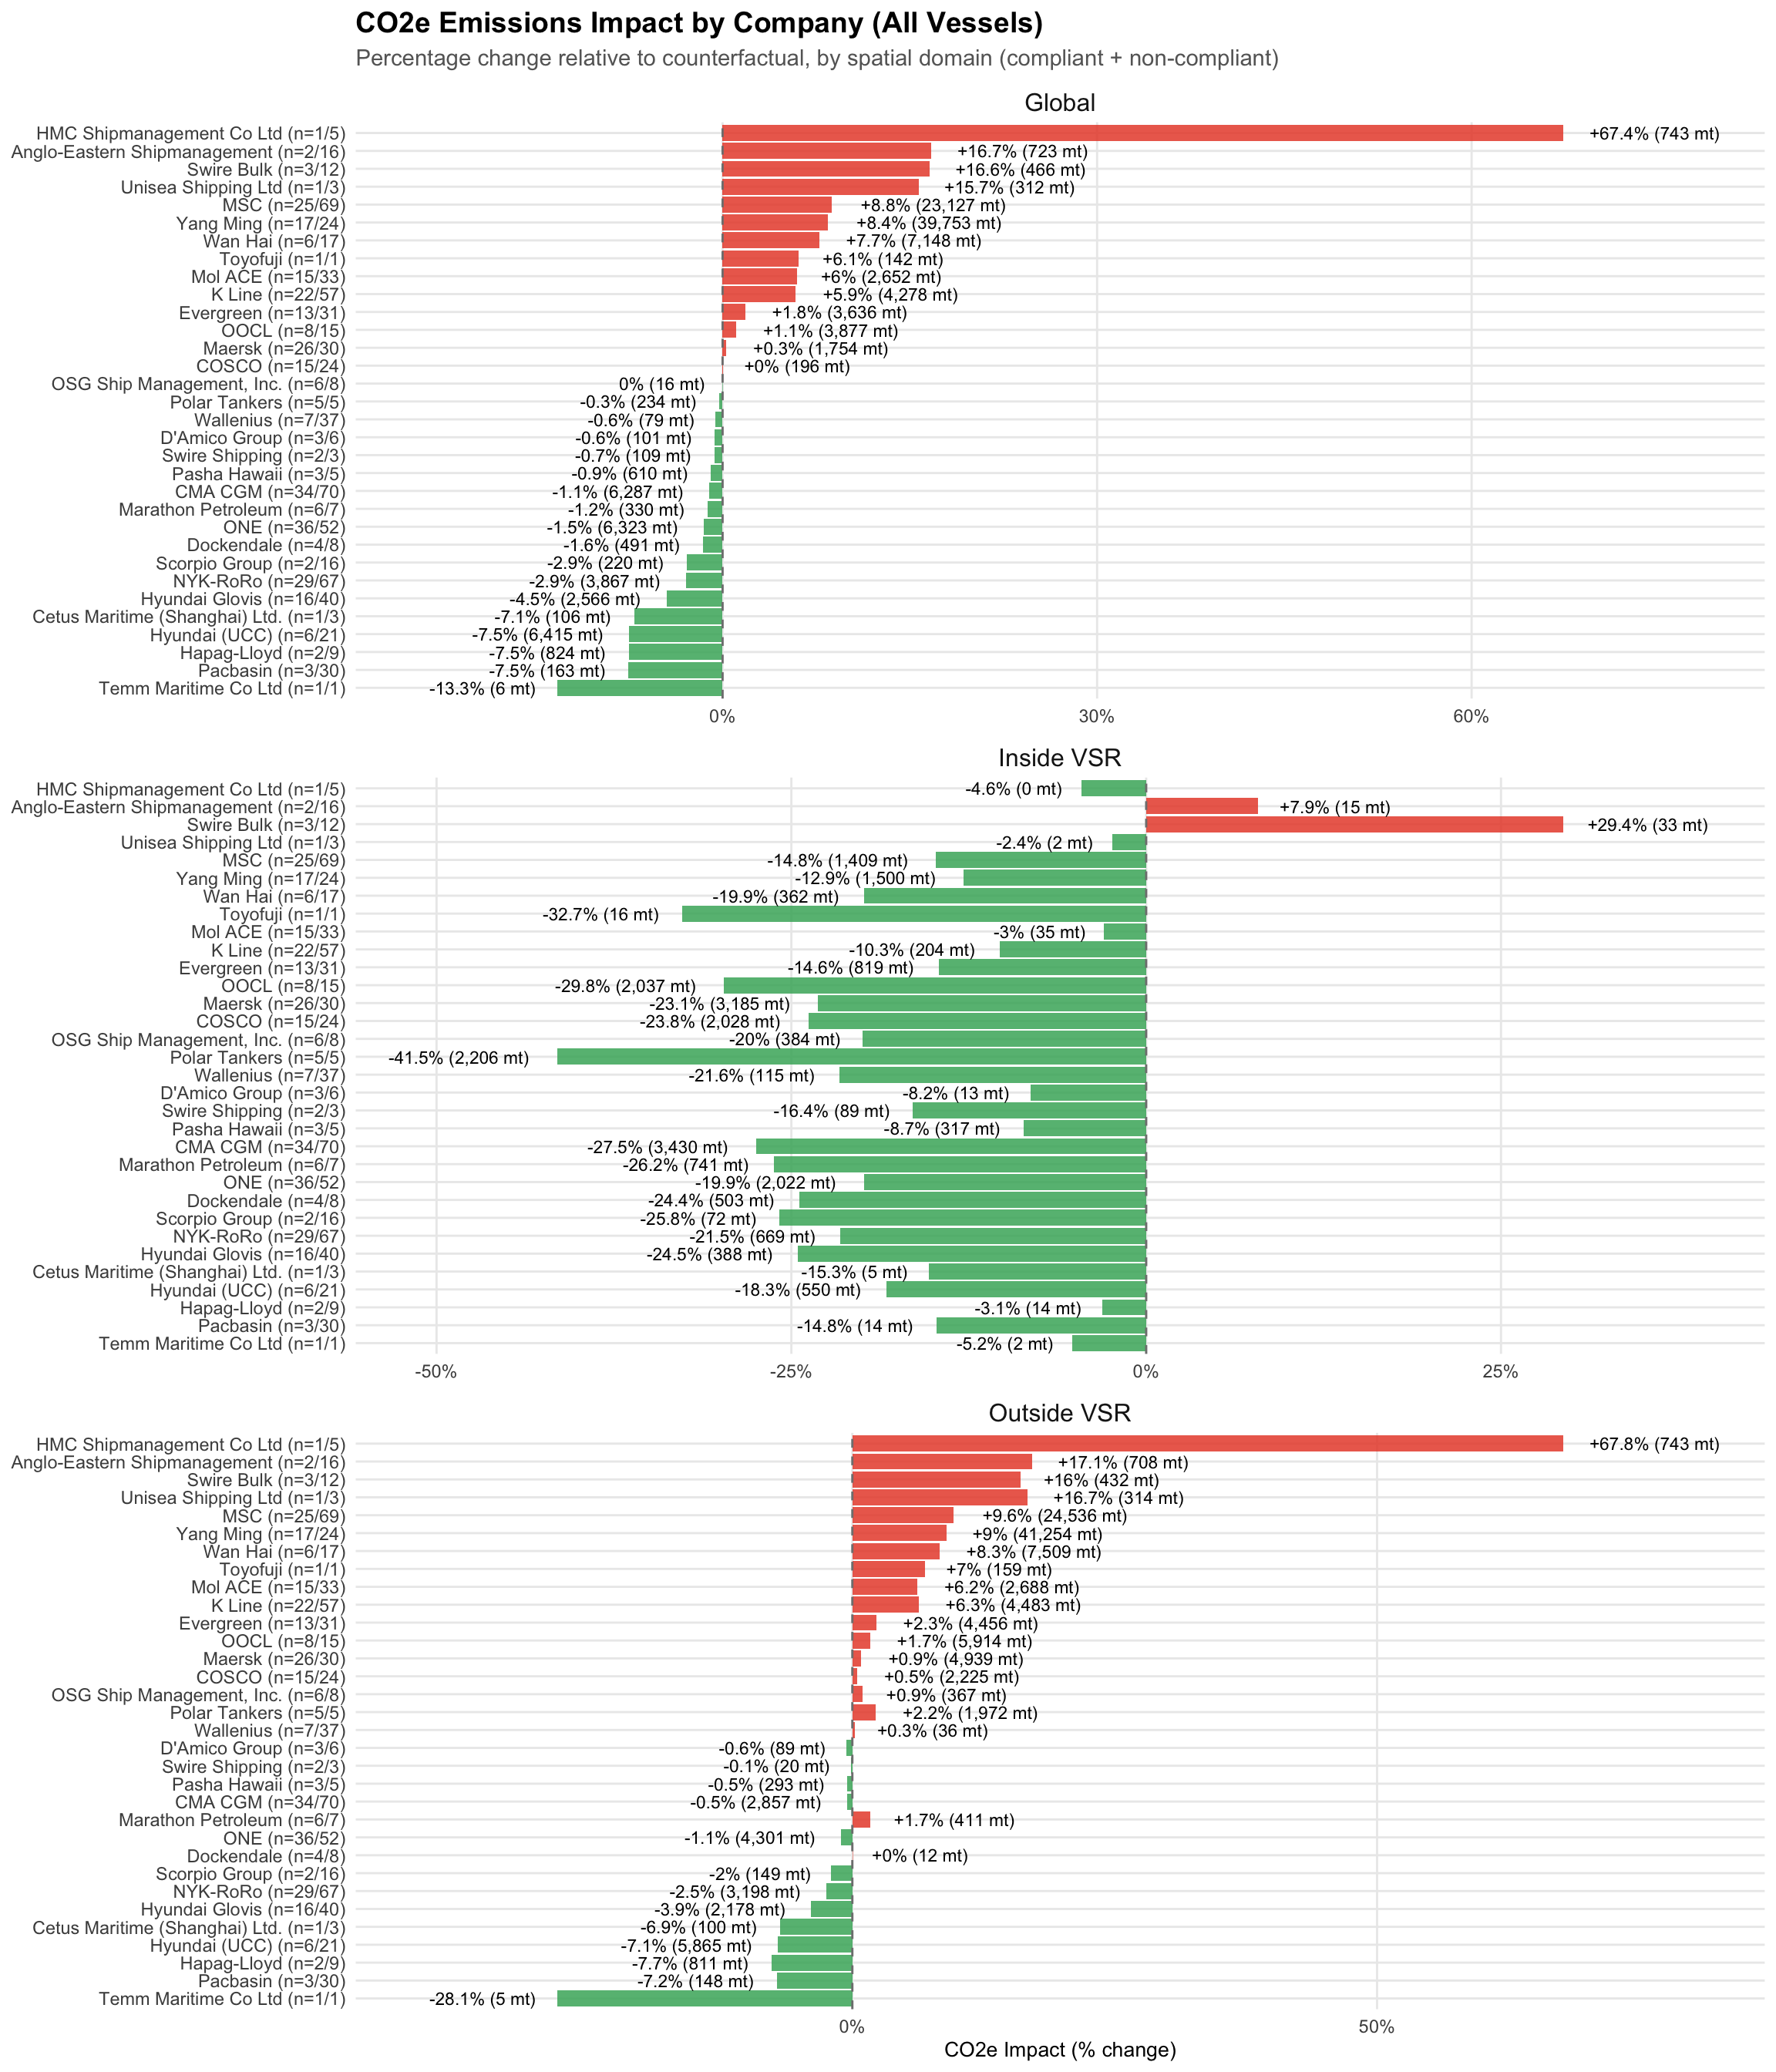
However, given that the definition of compliance is specific to this analysis, based on average speeds and including a safety margin of 0.4 knots around the 10 knot target speed, which differs from alternative definitions used in other studies such as Blue Whales Blue Skies (2025), overall company performance may vary. Thus, to better assess overall company impacts, Figure 3.14 includes all available vessels in the analysis for each company, rather than only the compliant subset. This provides a more complete picture of fleet-level effects. Under this broader view, a majority of companies still contribute to global emission reductions, although these are more modest than when considering only compliant vessels. Also we can see a larger change in emissions from companies with net emission increases with respect their baseline. Additionally, two companies show increased emissions within VSR zones when considering the entire matched fleet.
These results provide insights into the level of company participation in the program and how compliance with its targets can translate into measurable global emission reductions, helping to identify the most engaged participants. However, important limitations remain. The analysis includes only vessels with activity in both periods and both inside and outside the VSR, which restricts the ability to capture the full scope of each company’s fleet. Some vessels may be complying during the season and contributing to real emission reductions, but without corresponding baseline trips to construct counterfactuals, they cannot be included in the analysis. We also use a different definition of compliance in our analysis than the BWBS program as a whole; we assess compliance at the vessel-level, whereas the BWBS program assesses compliance at the company level. As a result, this company level assessment should be taken as illustrative, but not comprehensive or conclusive.