| Spatial Domain | Emissions Metrics | Activity Metrics | Emissions intensity |
|---|---|---|---|
| Entire Trip (Global) | CO2, N2O, CH4, CO2e (100yr & 20yr GWP), PM2.5, PM10, NOX, SOX, CO, VOCs | Distance (nm), Duration (h), Average Speed (knots) | Emissions per distance traveled (MT/nm) |
| Inside VSR Zones (Regional) | CO2, N2O, CH4, CO2e (100yr & 20yr GWP), PM2.5, PM10, NOX, SOX, CO, VOCs | Distance (nm), Duration (h), Average Speed (knots) | Emissions per distance traveled (MT/nm) |
| Outside VSR Zones (Spillover) | CO2, N2O, CH4, CO2e (100yr & 20yr GWP), PM2.5, PM10, NOX, SOX, CO, VOCs | Distance (nm), Duration (h), Average Speed (knots) | Emissions per distance traveled (MT/nm) |
2 Methods
This section describes the methodology used to quantify the net global emissions impact of the 2024 Blue Whales Blue Skies (BWBS) season. Our approach compares observed within-season emissions to those that would have occurred if before-season emission intensities had been maintained throughout the season.
2.1 Analytical Framework
While this analysis does not constitute a formal causal impact assessment of the BWBS program, it provides evidence as to whether net global emissions from vessels in the BWBS program are lower during the BWBS season compared to what would be expected based on their baseline behavior. Periods, emissions intensities, and counterfactual emissions are defined as:
- Baseline Period: The portion of 2024 outside the VSR season (January 1 - April 30 2024 for Northern California areas; and January 1- April 30 2024 and December 16-31 2024 for Southern California area)
- Within-Season Period: The active VSR season (May 1 - December 31 2024 for Northern California areas; and May 1 - December 15 2024 for Southern California area)
- Emissions Intensity: Emissions per unit distance traveled (metric tonnes per nautical mile)
- Counterfactual Emissions: Hypothetical emissions that would have occurred if baseline emissions intensity was maintained (calculated by multiplying each vessel’s 2024 baseline emissions intensity by the distance it traveled during the 2024 BWBS season).
2.2 Analysis Steps
The analysis is conducted through the following steps:
Trip Identification: For each vessel participating in the BWBS program, we identify all port-to-port trips that (1) started and ended in 2024, and (2) passed through at least one VSR zone. Each port-to-port trip is defined as a matched pair of subsequent port visits. We leverage GFW’s port visit and trip algorithm to do so (see here). Under this definition, a port visit begins when a vessel enters within 3 km of an anchorage and ends when it leaves a 4 km radius. To further exclude emissions associated with port activity, we remove any ping-level emissions linked to anchored and at-berth operational phases (Faber et al. (2020)).
Trip Classification: Each trip is classified as either “during” or “outside” the VSR season based on when the vessel travels through the speed reduction zones. If any ping within a VSR zone occurs during the active VSR dates, the entire trip is classified as “during”. Otherwise, the trip is classified as “outside”. For example, if a trip starts on April 25, the BWBS season starts May 1, and the vessel first enters a speed reduction zone on May 3, we will classify this trip activity as corresponding to “during” the season.
Trip-Level Statistics: For each trip, we use our ping-level AIS-based emissions model to estimate emissions for each GHGs and local pollutants for each of our activity metrics at three spatial scales. Our AIS-based emissions model is described in detail here.
- Baseline Calculation: For each vessel, we calculate the “baseline” 2024 emissions intensity from all trips that occurred outside the VSR season:
\[\text{Baseline Emissions Intensity}_v = \frac{\sum_{t} \text{Emissions}_{v,t}}{\sum_{t} \text{Distance}_{v,t}}\]
where the sums are over all trips \(t\) outside the VSR season for vessel \(v\).
Emissions intensity is calculated separately for Inside VSR zones (only those AIS pings that occur within speed reduction zones) and Outside VSR zones (only those AIS pings that occur outside speed reduction zones).
Within-Season Emissions: For each vessel, we calculate actual emissions and distance traveled during the VSR season, separately for inside VSR and outside VSR areas.
Counterfactual Calculation: For each vessel, we calculate hypothetical counterfactual emissions that would have occurred during the VSR season if baseline emissions intensity had been maintained. Regional counterfactuals are calculated separately for inside and outside VSR zones, each using its own region-specific baseline emissions intensity:
\[ \text{Counterfactual Emissions}_{\text{region}} = \text{Baseline Emissions Intensity}_{\text{region}} \times \text{Within-Season Distance}_{\text{region}}\]
The global counterfactual is defined as the sum of the regional counterfactuals, ensuring that:
\[\text{Counterfactual}_{\text{global}} = \text{Counterfactual}_{\text{inside VSR}} + \text{Counterfactual}_{\text{outside VSR}}\]
- Emissions Impact Estimation: The program impact is estimated as the difference between actual and counterfactual emissions. Negative values indicate emission reductions relative to the counterfactual, and positive values indicate emission increases relative to the counterfactul.
\[\text{Emissions Impact} = \text{Actual Emissions} - \text{Counterfactual Emissions}\]
This is calculated at three scales: global (sum of regional impacts), inside VSR, and outside VSR.
2.3 Spatial Analysis
To explore the geographic distribution of speed and emissions intensity changes, we aggregate ping-level data for compliant vessels onto a 0.25° × 0.25° grid. The spatial analysis is conducted as follows:
Grid assignment: Each AIS ping is assigned to a grid cell based on its latitude and longitude within a 0.25° × 0.25° grid.
Vessel–pixel aggregation: For each vessel, grid cell, and period (during vs. outside the VSR season), we calculate aggregate speed as total distance divided by total hours, and CO2e emissions intensity (100-year GWP) as total CO2e divided by total distance.
Within-vessel differencing: For each vessel and grid cell where both periods are observed, we compute the difference in speed and emissions intensity (within-VSR-season minus outside-season).
Pixel-level summary: Across all vessels present in a given grid cell, we take the median of the within-vessel differences, to get the typical change in speed and emissions intensity at each location.
Results are computed for three vessel groups: all compliant vessels, “catch-up” vessels (those that slowed inside VSR zones but sped up outside, driving the spillover effect), and “non-catch-up” vessels. This disaggregation allows us to spatially identify where catch-up behavior concentrates and how it differs from the rest of the compliant vessels.
2.4 Defining compliant vessels
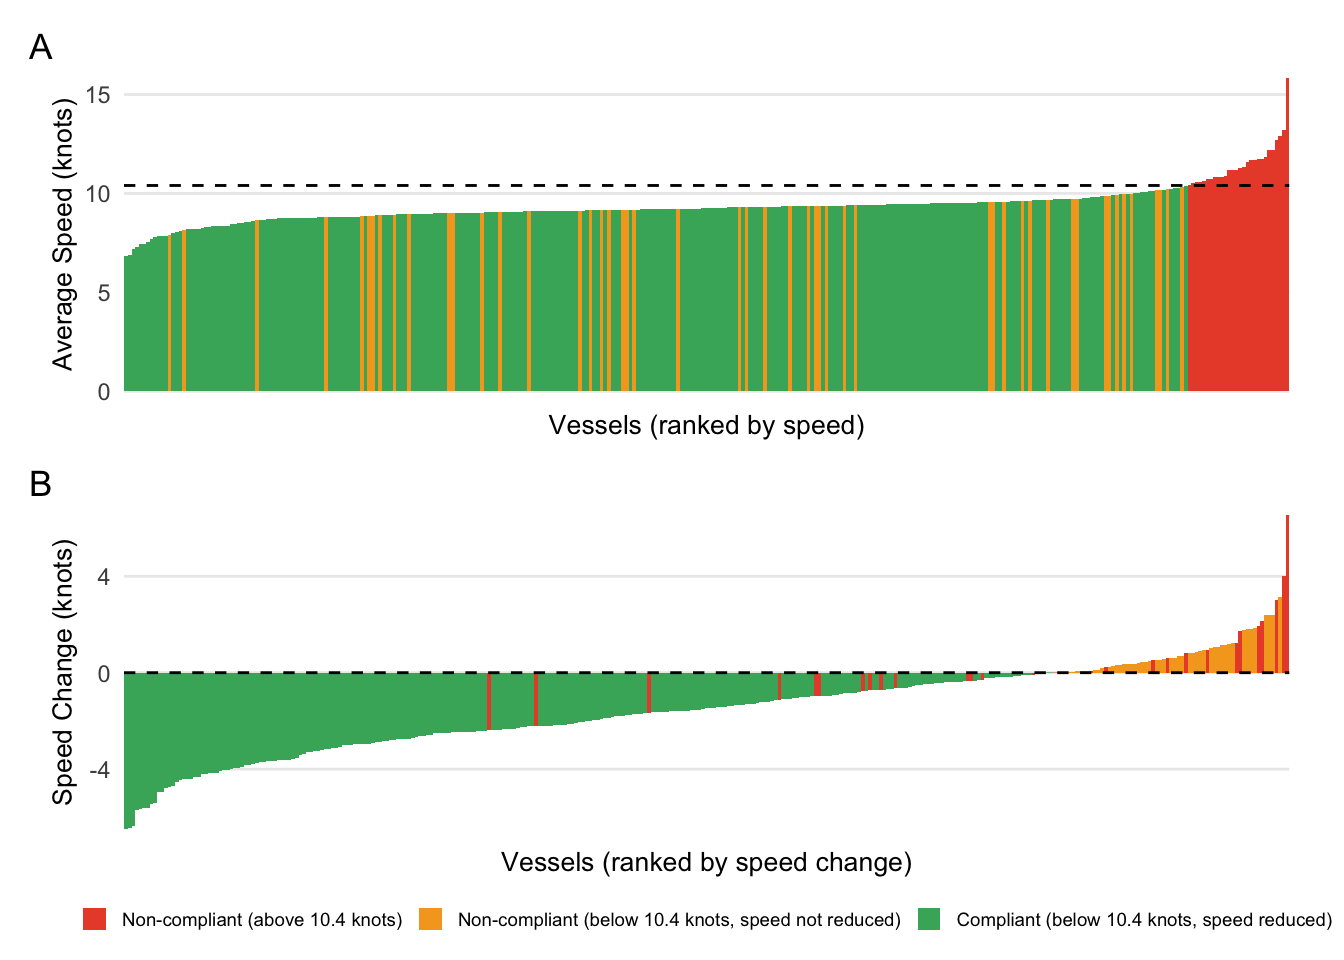
The VSR program sets a target speed of 10 knots within the designated zones. To allow for a degree of flexibility, we use a compliance threshold of 10.4 knots. As it is a voluntary program, not all participating vessels reduced their speeds below this threshold in 2024. Additionally, we focus only on those vessels that have a lower speed inside the VSR zones during the season than they did outside the season. In other words, if vessels didn’t change their speed inside the VSR zone, or in fact actually speed up, we exclude them for our definition of vessels participating in the program.
Figure 2.1 shows that from the total 321 vessels analysed, 91.3% of them (293 vessels) navigated, on average, below 10.4 knots inside VSR zones during the season, and that 80.4% of vessels (258 vessels) reduced their average speed from the baseline to the season period within the VSR zones. These results indicate that compliance with the target speed does not necessarily imply a change in behavior due the program, as some vessels navigated below 10.4 knots but did not reduce their speed relative to the baseline.
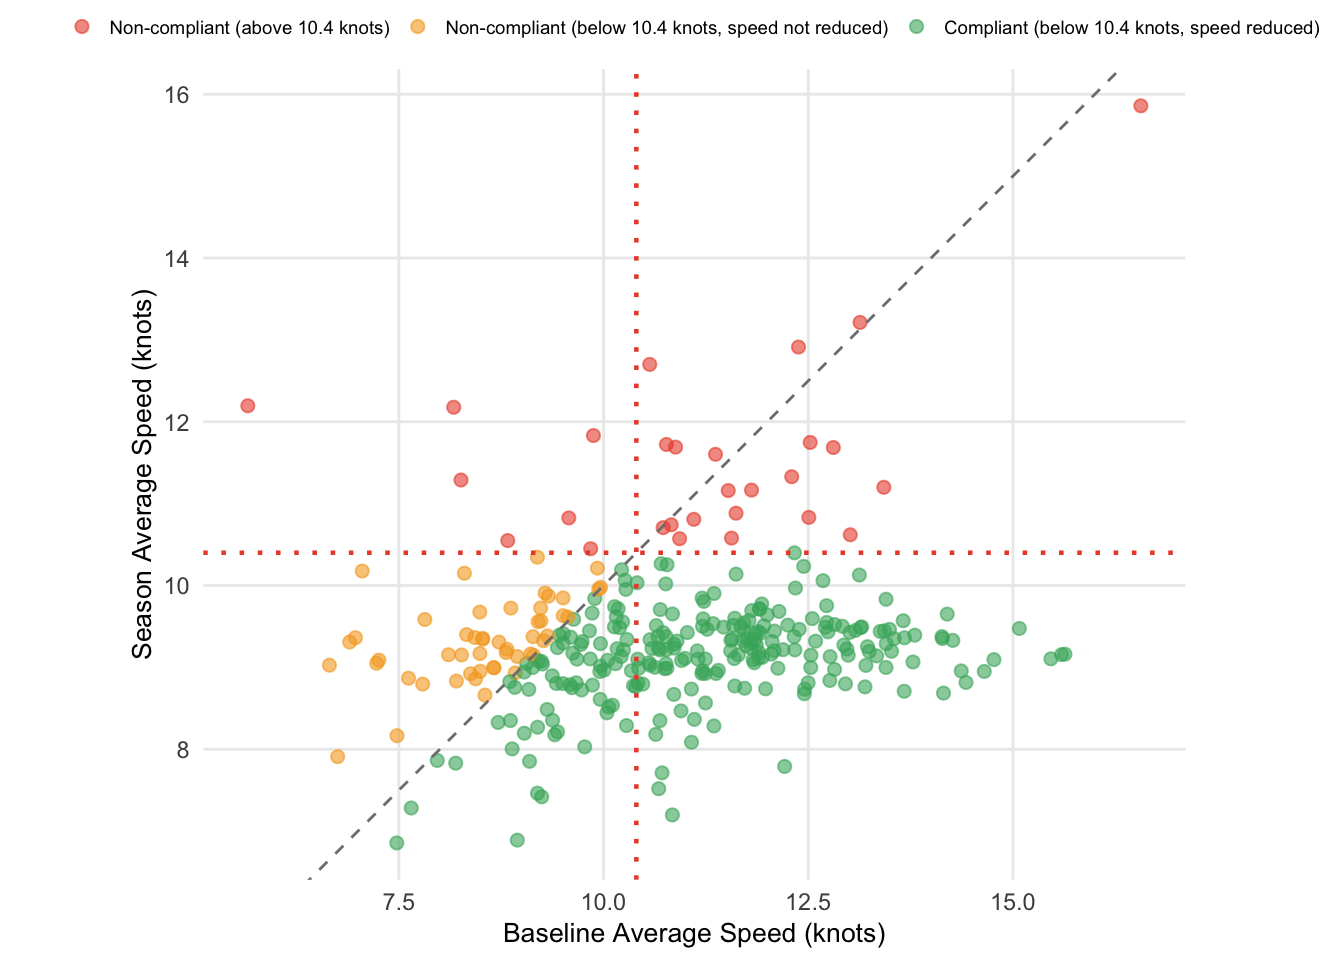
Figure 2.2 further categorizes vessels by their behavior relative to the 10.4-knot threshold, showing that 75.7% of vessels were both below 10.4 knots and reduced their speed during the season. These 243 vessels, which both navigated below the target speed and adapted their behavior during the season within the VSR, are considered to fully comply with the program goals and are therefore the vessels of interest analyzed in this study.
2.5 CO2 Equivalent Calculation
CO2 equivalent (CO2e) emissions are calculated using Global Warming Potentials (GWPs) from the IPCC Sixth Assessment Report (Forster et al. 2021). We report results using both 100-year and 20-year time horizons:
| Gas | GWP (100-year) | GWP (20-year) | Source |
|---|---|---|---|
| N2O | 273 | 273.0 | IPCC AR6 |
| CH4-non fossil | 27 | 79.7 | IPCC AR6 |
The 100-year GWP is the standard metric for climate policy and international agreements, while the 20-year GWP better captures the near-term warming impact of short-lived climate pollutants like methane.
100-year GWP formula:
\[\text{CO}_2\text{e}_{100yr} = \text{CO}_2 + (273 \times \text{N}_2\text{O}) + (27 \times \text{CH}_4)\]
20-year GWP formula:
\[\text{CO}_2\text{e}_{20yr} = \text{CO}_2 + (273 \times \text{N}_2\text{O}) + (79.7 \times \text{CH}_4)\]
2.6 Important Caveats
This analysis compares observed behavior during the VSR season to a baseline established from the same vessels outside the season on the same year. However, several factors could confound the results:
- Fuel prices: Changes in fuel costs could affect vessel speed and routing decisions
- Queuing systems: Port congestion and scheduling changes
- Weather events: Extreme weather affecting vessel routes and speeds
- Trade shifts: Changes in global shipping patterns
- Fleet logistics: Vessels may operate different routes during different seasons
Using our current methods, we are also only able to analyze the subset of vessels with observed trips that pass through VSR zones both during and outside the 2024 season. We also do not analyze any vessels that were are not listed as participants in the BWBS program, although non-participating vessels may be able to provide additional information for determining the counterfactual amount of emissions that would occur without the program.
Therefore, this analysis can only determine whether emissions are higher or lower during the VSR season compared to a scenario in which vessels maintained the same baseline emissions intensity; and it can only determine that for the subset of vessels for which we have the necessary data. As such, it does not constitute a causal impact assessment and cannot definitively attribute any observed changes to the BWBS program itself.