| Area_Name | Region | Season Dates |
|---|---|---|
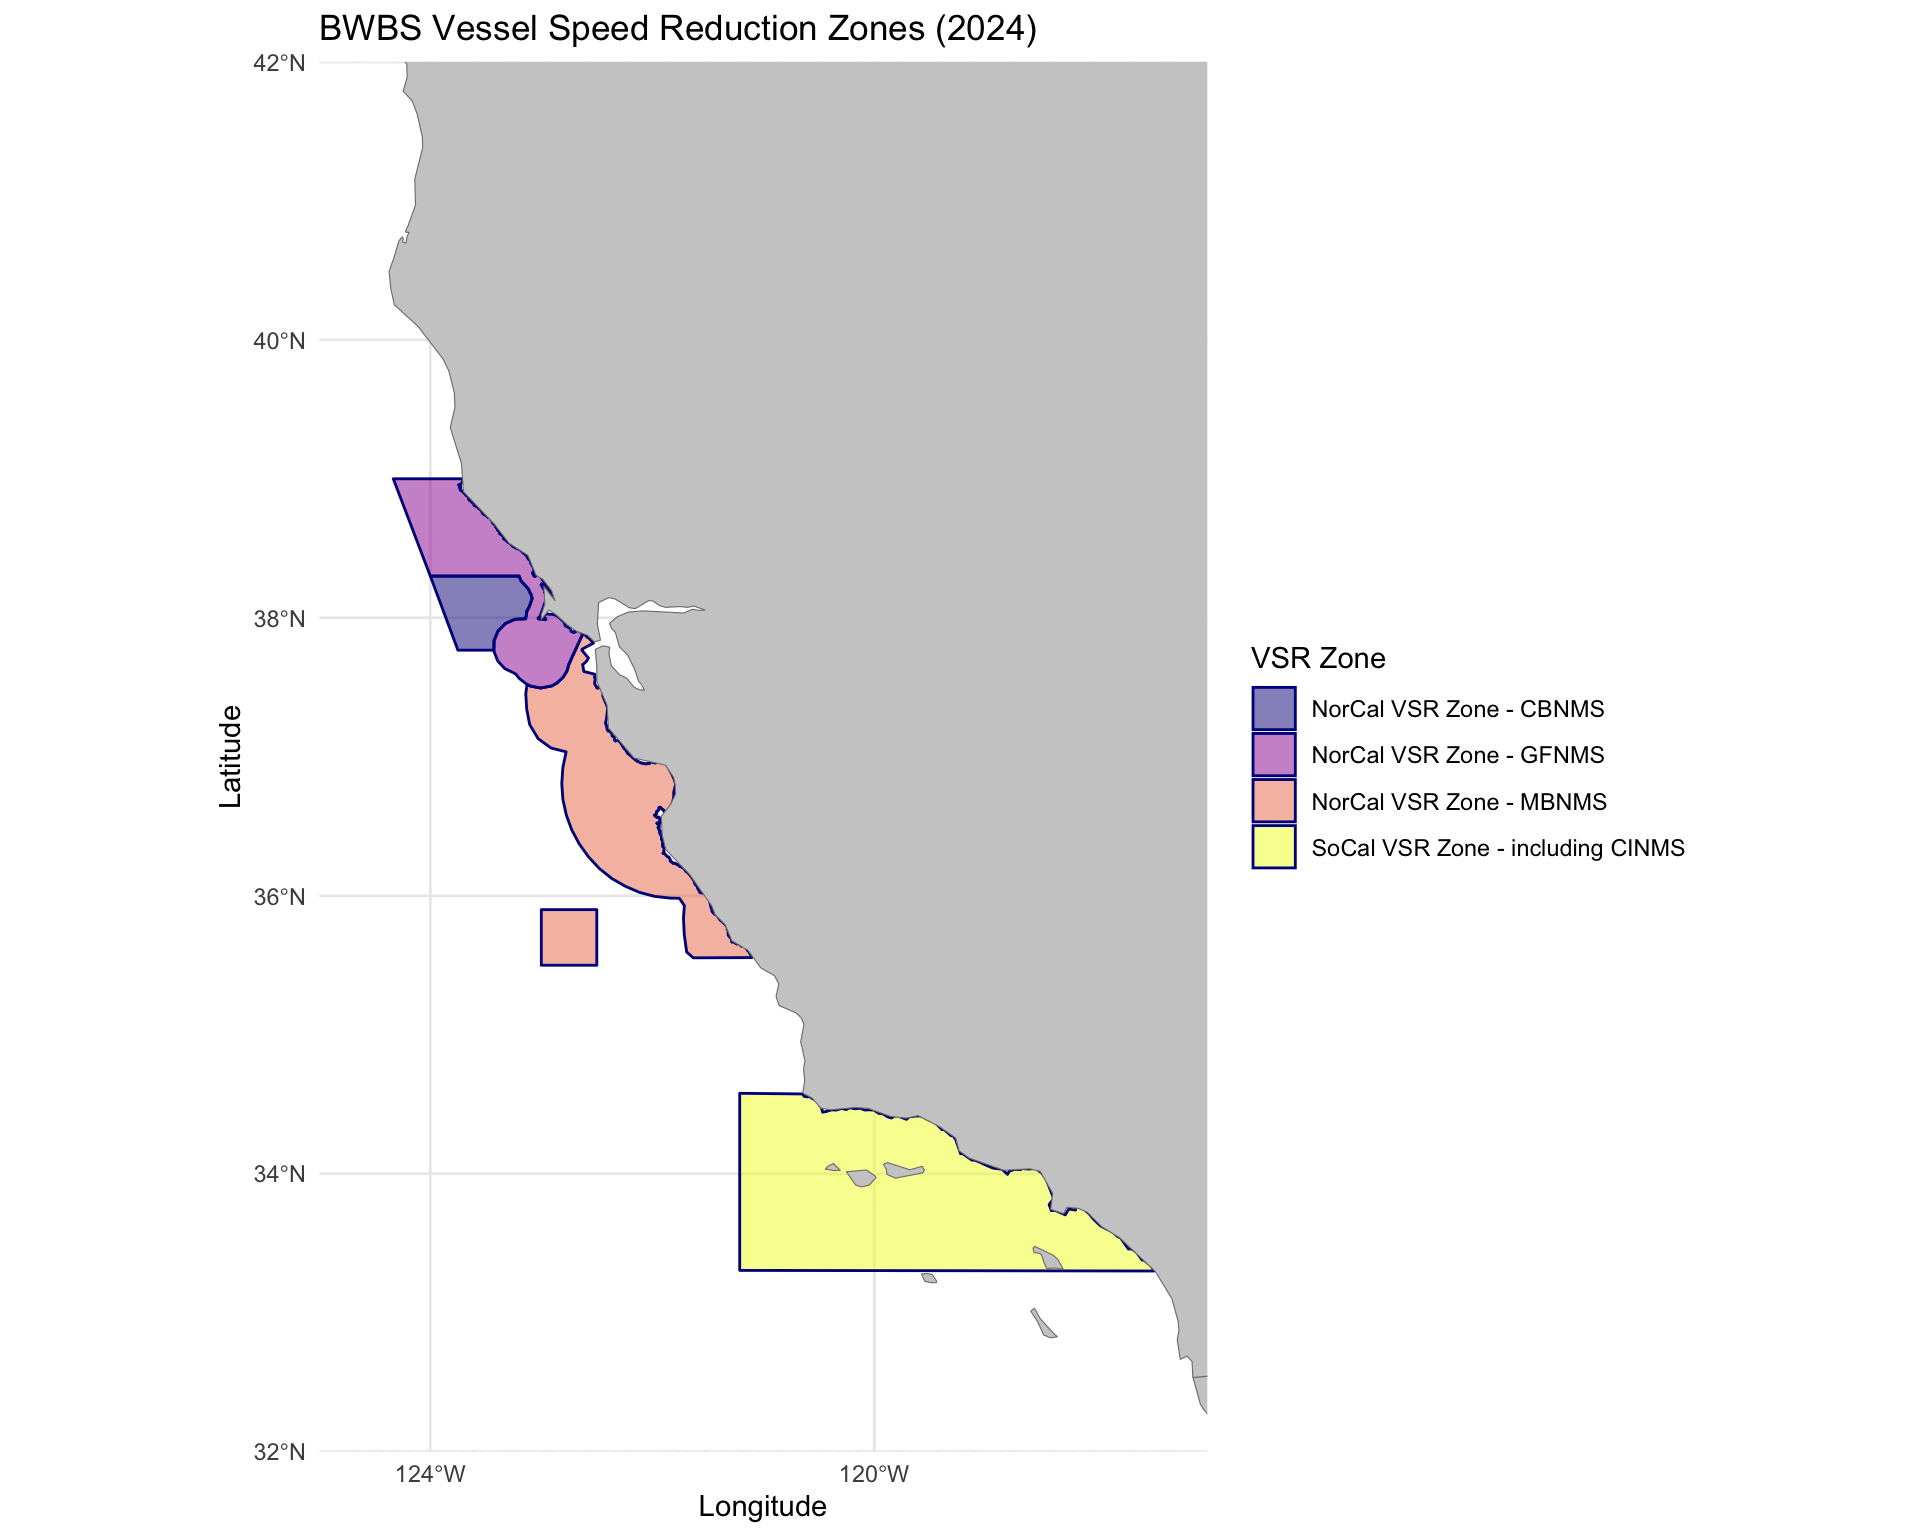
| NorCal VSR Zone - MBNMS | Northern California | May 1 - December 31, 2024 |
| NorCal VSR Zone - GFNMS | Northern California | May 1 - December 31, 2024 |
| NorCal VSR Zone - CBNMS | Northern California | May 1 - December 31, 2024 |
| SoCal VSR Zone - including CINMS | Southern California | May 1 - December 15, 2024 |
1 Data
This section describes the data sources and inputs used in this analysis. The analysis integrates vessel emissions data from emLab and Global Fishing Watch (GFW) emissions model with program participation data from the Blue Whales Blue Skies (BWBS).
1.1 Data Sources
1.1.1 BWBS Vessel List
BWBS provided a list of participating vessels for the 2024 season. This list includes vessel identifiers that are matched against those from vessels in the GFW emissions database.
We successfully matched 738 vessels to the GFW emissions database, out of 757 vessels in the original BWBS list. The missing 19 vessels could not be matched due to differences in vessel registry coverage and filtering criteria applied during the construction of the GFW emissions database. All vessels except one could potentially be recovered in future iterations by updating the filtering criteria of our underlying emissions model, but this would require a full rerun of the model. Given the limited scope of this project, we therefore proceed with the matched 738 vessels. More details about missing vessels and matching issues are described here.
Note that a small number of matched vessels (7 out of 738) were classified by GFW as non-shipping categories such as fishing, patrol, seismic, supply, and tug vessels. These classifications are based on GFW’s vessel registries and vessel characterization algorithms and thus reflect likely vessel class misclassification. This generally will have little impact on the results of this project since emissions are primarily driven by engine size and design speed, which are not affected by vessel class. However, vessel class does impact our estimates of boiler and aux engine power, which means that misclassified vessel class will lead to slight discrepancies in emissions for these 7 vessels. Given their minimal share of the fleet, they are retained in the analysis but flagged here for transparency.
1.1.2 Vessel Speed Reduction (VSR) Zones
The BWBS program operates in designated VSR zones along the California coast, covering both Northern California (San Francisco/Monterey region) and Southern California regions.
1.1.3 GFW Emissions Data
Emissions data is obtained from the emLab-GFW emissions model, which provides ping-level emissions estimates for vessels operating globally. The model estimates emissions across multiple pollutants based on vessel characteristics and AIS-derived speed and activity patterns. You can find more details here.
1.2 Data coverage
1.2.1 Vessel Matching Results
The BWBS vessel list was matched against the GFW emissions database using a hierarchical matching process based on MMSI, IMO number, and vessel name.
| match_type | Number of Vessels | Percentage |
|---|---|---|
| mmsi + imo + name | 671 | 90.92% |
| mmsi + imo | 19 | 2.57% |
| imo + name | 21 | 2.85% |
| imo only | 11 | 1.49% |
| mmsi only | 4 | 0.54% |
| name only | 12 | 1.63% |
1.2.2 Trip Coverage
In order to conduct our analysis, we can only include the subset of vessels that have trips that occur both inside and outside the VSR season, and both inside and outside the VSR zones. It is only for this subset of vessels that were able able to calculate baseline (outside-season) emissions intensities, as well as inside observed and counterfactual emissions. In Table 1.3 we can see that only a subset of vessels (42.4%) have both baseline and within-season data, including observations inside and outside VSR areas. These are the vessels for which the analysis can be conducted.
We should note that our analysis only includes trips that spatially intersect with the VSR zones; we do not look at trips that completely bypass the VSR zones. However, vessels may choose alternative routes between ports to avoid these areas. We do not include this activity in the analysis. However, due to the locations of the VSRs, it is highly unlikely that vessels would be able to still visit the same ports while completely bypassing the zones: entering into San Francisco Bay area ports requires passing through at least one of the northern VSR zones; entering into Long Beach and Los Angeles area ports requires passing through the southern VSR zone.
| Category | During VSR season | Outside VSR season | N | % | N | % |
|---|---|---|---|---|---|---|
| All listed vessels | — | — | 757 | 100.00% | — | — |
| Matched vessels | — | — | 738 | 97.49% | — | — |
| With trip data | — | — | 682 | 90.09% | 5027 | 100.00% |
| No trip data | — | — | 56 | 7.40% | 0 | 0.00% |
| Only during season | Both inside & outside VSR | — | 344 | 45.44% | 1187 | 23.61% |
| Only outside season | — | Both inside & outside VSR | 13 | 1.72% | 24 | 0.48% |
| Both periods | Both inside & outside VSR | Only inside VSR | 4 | 0.53% | 29 | 0.58% |
| Both periods | Both inside & outside VSR | Both inside & outside VSR | 321 | 42.40% | 3787 | 75.33% |