Quantifying Ocean-based Greenhouse Gas Emissions
Introduction
A Global Emissions Pilot Study by emLab and Global Fishing Watch
For the first time, we have mapped and estimated the emissions of all industrial vessels operating in the ocean. Our analysis covers 864,738 ocean-going vessels that broadcast their GPS positions using the Automatic Identification System (AIS). Additionally, we used satellite radar from Sentinel-1 to detect vessels not tracked by AIS by leveraging over 33 million vessel detections across more than 959,000 radar scenes. These “dark fleet” vessels provide a more comprehensive picture of human activity at sea, since they have typically remained undetected through traditional tracking systems until now. This pilot study focused on large industrial vessels, specifically those over 15 meters in length, and their activity from 2017 through present (and back to 2015 for AIS-broadcasting vessels). These new data improve our understanding of how much greenhouse gas (GHG) emissions are produced at sea and provide actionable information to willing actors seeking to reduce emissions. While our approach is still under active development, we hope to continue refining and expanding our model over the coming year and to eventually publish the work in a high-impact peer-reviewed scientific journal. Future work will focus on expanding coverage and improving accuracy of our total marine emissions, allowing us to further unlock and inform various types of policy and/or market-based solutions that could help reduce at-sea GHG emissions.
Key Findings:
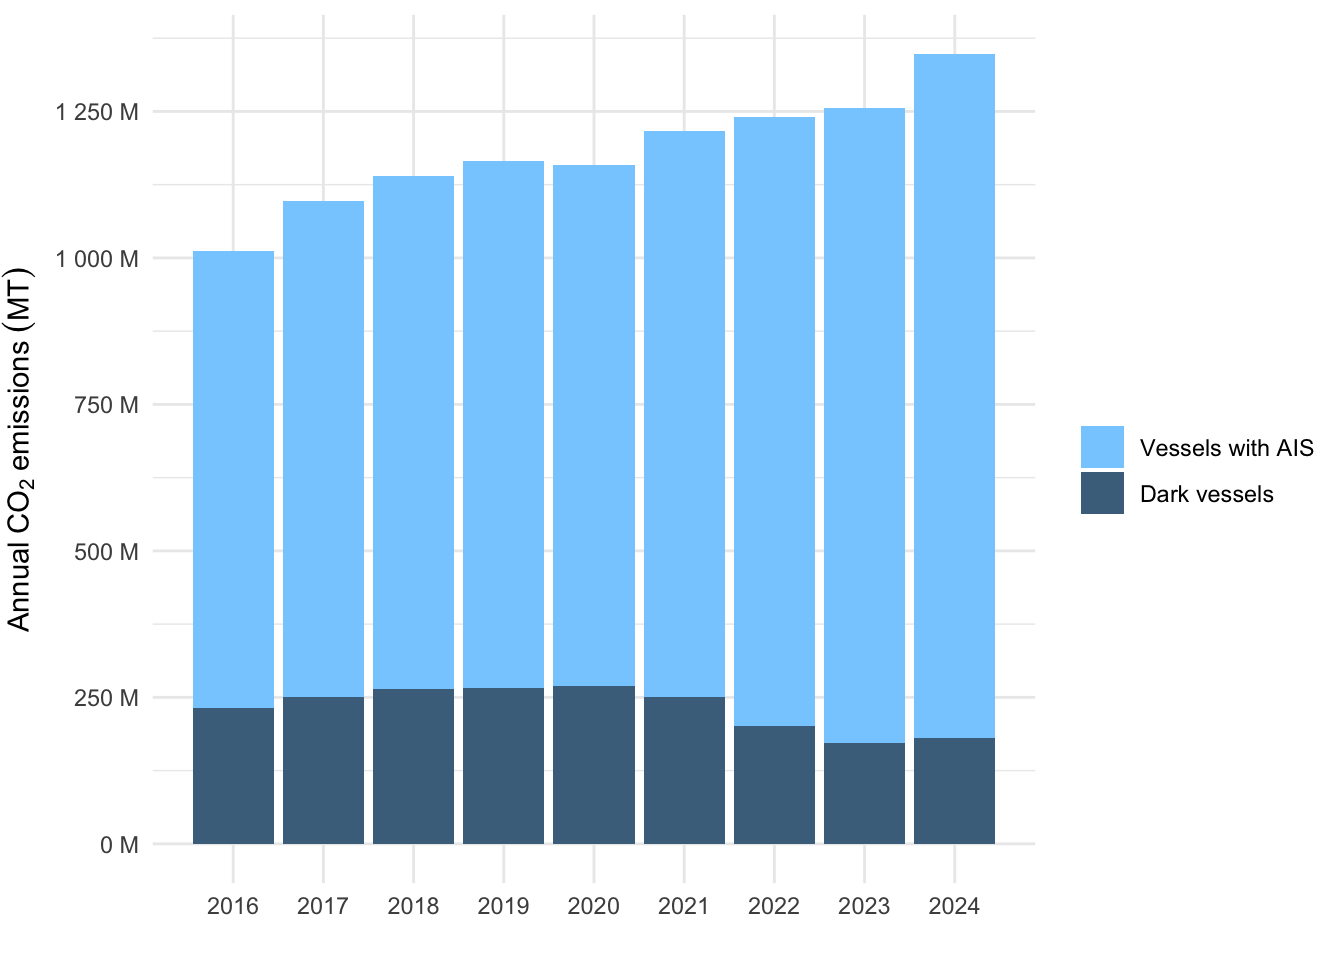
Industrial vessels emitted approximately 1.6 billion tons of CO2 in 2025, accounting for about 4.1% of global energy-related CO2 emissions (using the 2025 estimate of 38.4 billion tonnes from (IEA) (2026)).
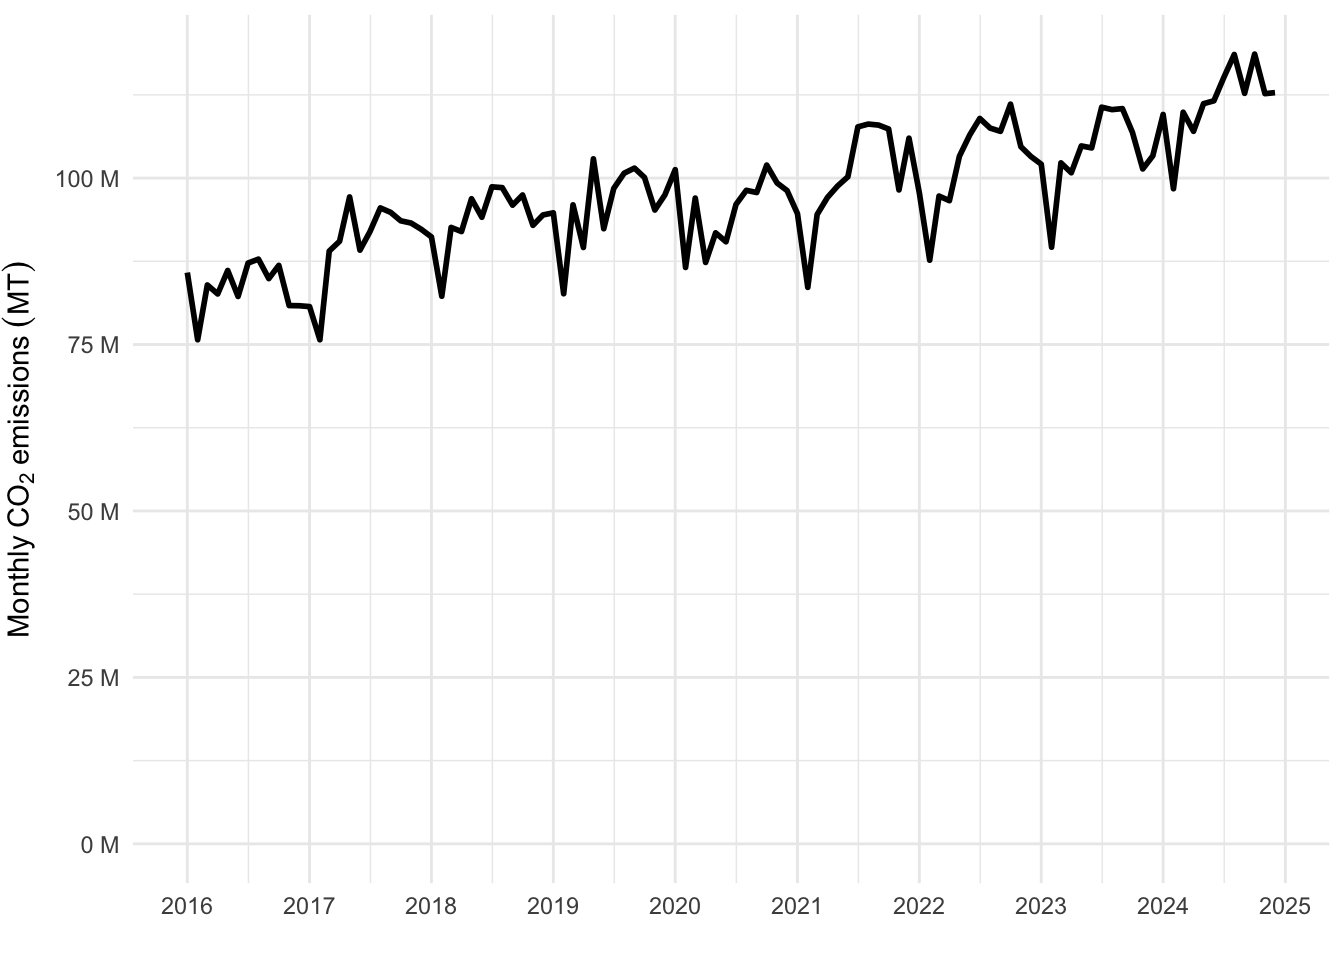
Maritime emissions are likely growing at roughly 4 times the rate of global CO2 emissions. Between 2017 and 2025, global energy-related CO2 emissions increased by about 8% ((IEA) (2023); (IEA) (2025); (IEA) (2026)), while emissions from maritime vessels grew by 33%.
While 75% of maritime emissions in 2025 came from vessels that broadcast their positions via AIS, 25% came from dark fleet vessels that do not broadcast AIS. Understanding dark fleet activity is crucial for estimating both the magnitude of total emissions and tracking changes over time. Emissions from dark vessels decreased by 9% between 2017 and 2025, whereas emissions from AIS-broadcasting vessels rose by 44% over the same time period. This shift is largely due to increased AIS adoption and advancements in AIS technology.
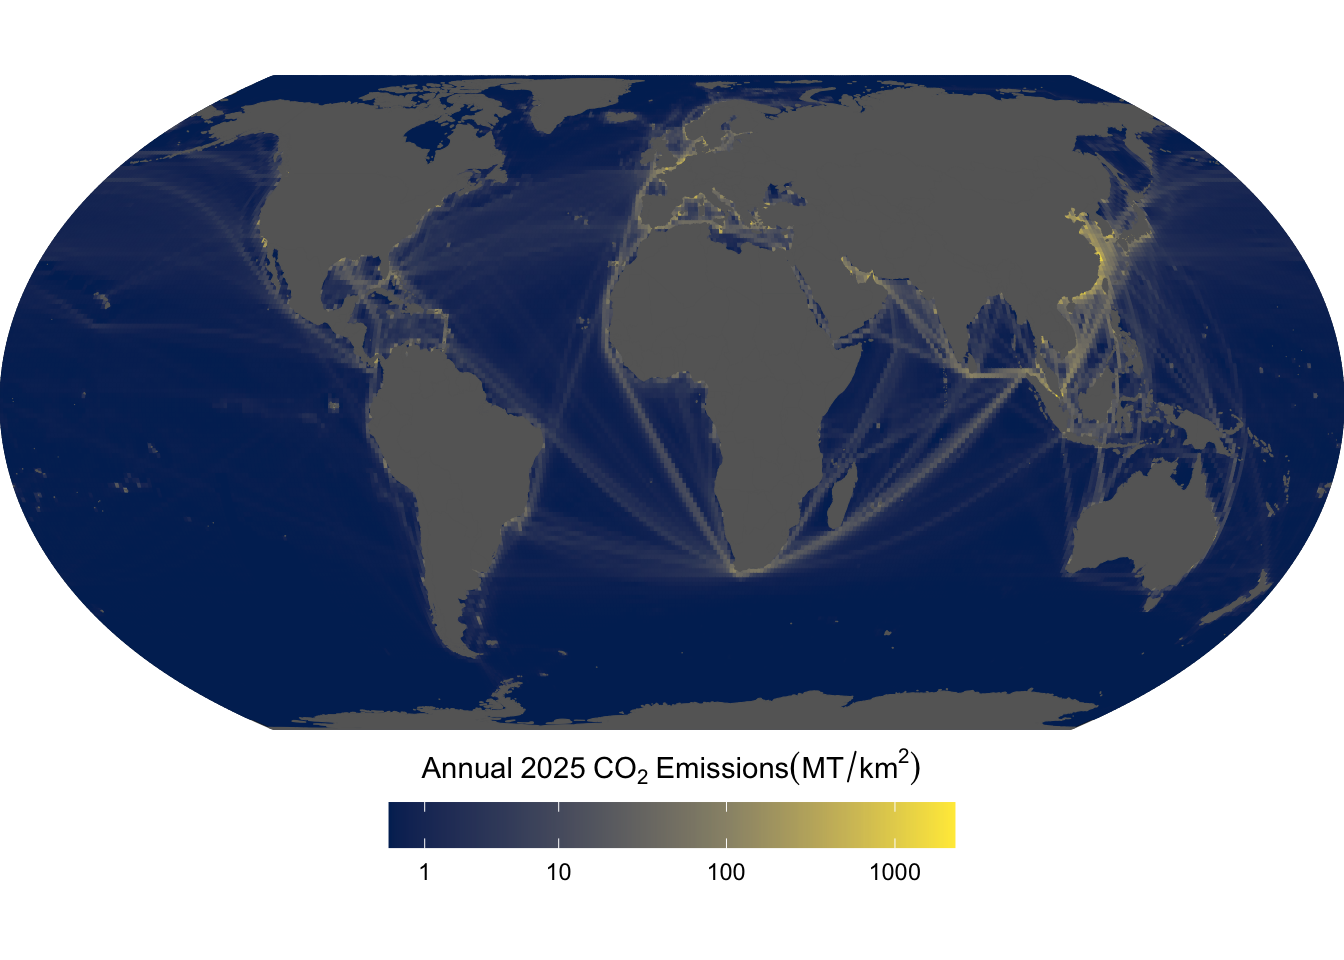
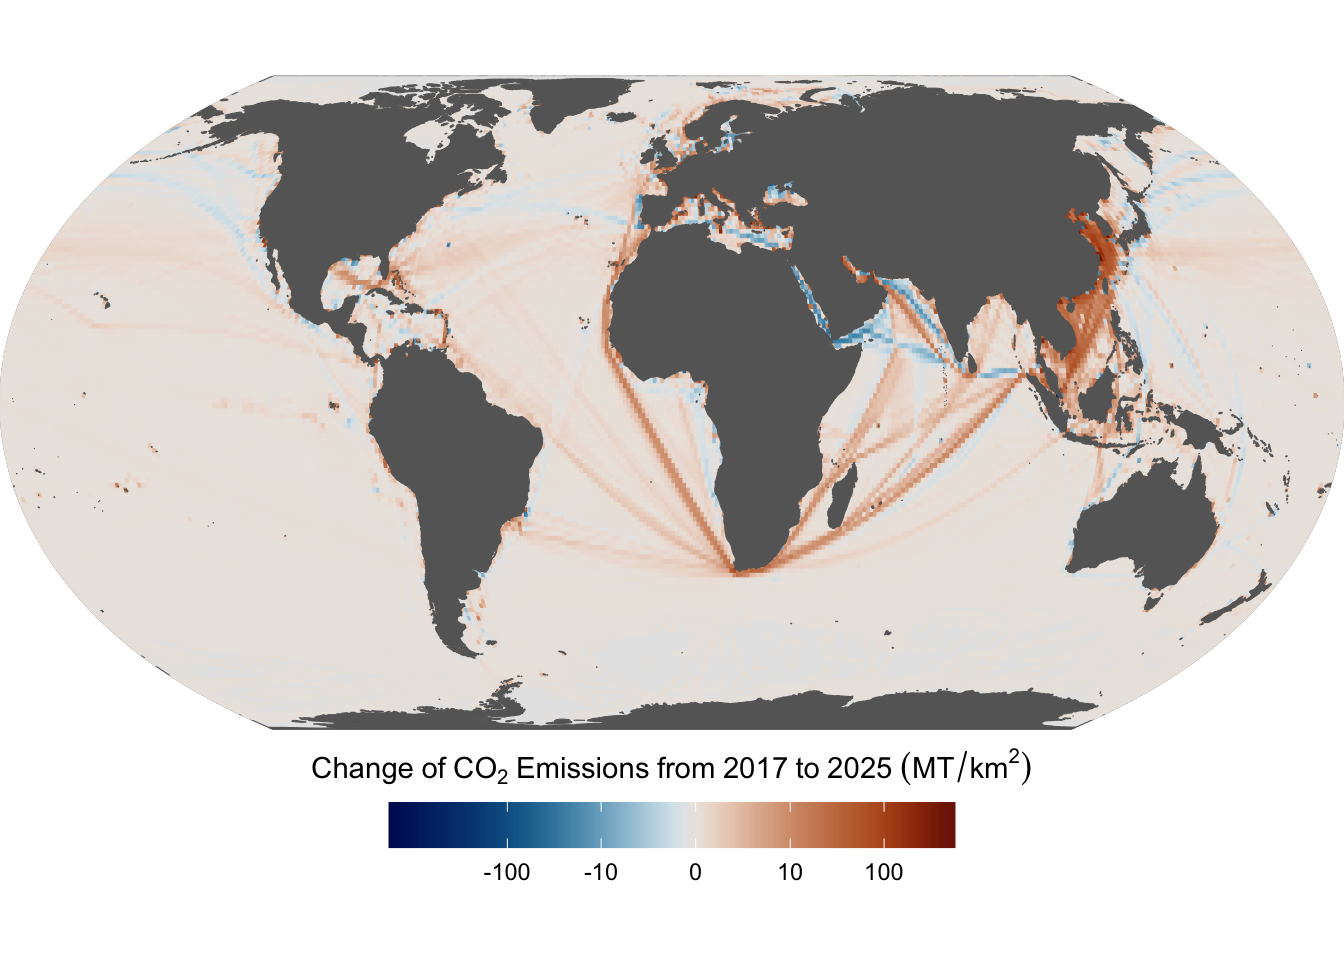
Our analysis also revealed seasonal and event-driven variations in emissions. Emissions consistently dipped during major holidays, including Christmas, New Year’s Day, and Chinese New Year, and also fell during the COVID-19 pandemic. Furthermore, our analysis also shows changes in the geographical distribution of emissions that are likely driven by new policies and infrastructure development.
Our AIS-based emissions estimates align closely with other published sources: the latest EDGAR estimates from 2024 are 860 MMT; the latest OECD estimates from 2024 are 862 MMT; the latest IMO estimates from 2018 are 1.06 B MT; and we estimate approximately 1.5 B MT CO2 in 2024. For context, our 2024 estimate represents about 3.9% of the IEA’s 2024 estimate of 37.8 billion tonnes of global energy-related CO2 emissions ((IEA) (2025)).
Model improvement change log
July 2026 data delivery (_v20260714)
AIS-based emissions model
[Changed] Updated model_number to _v20260714
[Changed] Updated underlying GFW data and algorithms to use the most up-to-date GFW data processing pipeline, V4 (updated from V3)
[Changed] Added noise filters to mitigate GNSS interference, which can place AIS positions far from a vessel’s true location: we now drop pings whose reported speed exceeds twice the vessel’s design speed, and keep only pings that fall in ocean (non-inland) raster cells, removing positions that erroneously land on shore
[Changed] Improved low-load emissions correction factors to account for inefficient main engine propulsion during low loads, using more precise data from the EPA and an interpolation algorithm
[Changed] Increased the number of port visits and voyages that are included by expanding our criteria from just the highest-confidence visits and voyages (confidence level 4 or C4) to also include the next level down (confidence level 3 or C3). Meanwhile, to remove potentially erroneous activity, we filter out any port visits or voyages that were over 3 years in duration since these likely only appear so long due to gaps in AIS transmission.
[Changed] Disaggregated the vessel class
Chemical/oil tankerinto two separate classesChemical tankerandOil tankerfor refined emissions estimates by vessel type[Changed] We now account for different engine types for each vessel (e.g., oil or gas) and their associated emissions profiles; this involved developing a new machine learning model to predict engine type metadata based on a set of known registered vessels
[Changed] Developed improved machine learning models for predicting vessel class, main engine power, length, design speed, and gross tonnage
[Changed] Fuel-based emissions factors for CO2 and SOX. CO2 and SOX emissions factors are now derived from an explicit model of each engine’s specific fuel consumption (SFC), using the baseline SFC values of Table 19 of the 4th IMO GHG Study (by engine type — slow-, medium-, or high-speed diesel, or turbine — and engine build-year generation) together with the IMO’s fuel carbon factors (Table 21) and sulphur equation (Equation 15). Previously these factors were constant g/kWh values from the 2017 ICCT lookup tables, which embed a single fixed SFC. A load-dependent SFC correction (4th IMO Equation 11) is applied to internal-combustion main engines, capturing elevated fuel consumption at low engine loads. Measured impact (full rebuilt series, 2015–2025, vs the previous
_v20260701delivery): total CO2 roughly flat at −1.9% (−2.6% pre-2020, −1.5% post-2020) — newer engines’ lower Table-19 SFC roughly offsets the low-load SFC penalty and the operational-phase fix below.[Changed] PM10 and PM2.5 computed from the IMO sulphur equations. PM10 is now computed from Equations 16 (HFO) and 17 (MDO/MGO) of the 4th IMO GHG Study on the same SFC basis as CO2/SOX, with PM2.5 = 0.92 × PM10; previously PM was derived by scaling the CO2 emissions factor by fixed fleet-average ratios. Measured impact (2015–2025 vs the previous
_v20260701delivery): pre-2020 PM decreases 49%; post-2020 PM increases 47% (PM10 and PM2.5 change nearly identically). See the sulphur-cap item below for why post-2020 PM rises.[Changed] IMO 2020 sulphur cap now handled via the sulphur equations rather than flat multipliers. Pre-2020 (HFO 2.7% sulphur) and post-2020 (HFO capped at 0.5%; MDO/ECA components unchanged) emissions factors are carried as parallel columns and selected by ping year. This replaces the previous flat post-2020 multipliers (×0.2 for SOX, ×0.206 for PM), which were HFO-only ratios incorrectly applied to our (HFO + 2×MDO)/3 fuel blend — two-thirds of the blend was already sulphur-compliant before 2020, so the old multipliers over-suppressed post-2020 SOX and PM. Measured impact (2015–2025 vs the previous
_v20260701delivery): post-2020 SOX increases 22%; pre-2020 SOX decreases 4%; contributes to the post-2020 PM increase above.[Changed] VOCs moved to IMO energy-based factors. VOCs (NMVOC) emissions factors now come from Appendix M, Table 61 of the 4th IMO GHG Study (g/kWh by engine type), replacing the old fixed CO2-scalar derivation. Measured impact (2015–2025 vs the previous
_v20260701delivery): VOCs decrease 24%.[Added] Fuel consumption as an internal output. Fuel consumption (mt) is now computed per ping from the SFC model and carried through all internal tables (≈ 32–33 M mt/month fleet-wide), enabling direct validation against EU MRV reported fuel consumption. It is not part of the delivered Climate TRACE schema.
Dark fleet emissions model
[Changed] Updated model_number to _v20260714
[Changed] Updated to the latest S1 detection dataset (
sentinel1_clean_v20250827), which includes a refined matching score for determining whether each S1 vessel detection is broadcasting or non-broadcasting[Changed] S1 detections that match to an AIS vessel are now treated as dark if that vessel is not included in our AIS-broadcasting emissions estimates (e.g., vessels excluded for identity offsetting or other quality filters). Previously such detections were counted as AIS-broadcasting even though no AIS-based emissions were estimated for them; this change attributes their emissions to the dark fleet and substantially increases dark fleet emissions estimates
[Changed] KNN interpolation of dark-to-AIS-broadcasting ratios is now exact and global: nearest neighbors are selected from precomputed distances between all pixel pairs on a fixed global ocean grid, with no distance cutoff.
Uses latest AIS-broadcasting emissions estimates (AIS model version _v20260714) as the basis for dark emissions estimates
September 2025 data delivery
Dark fleet emissions model
[Changed] Updated model_number to _v20250901
[Changed] Uses an improved matching score for determining whether each S1 vessel detection is broadcasting or non-broadcasting
July 2025 data delivery
AIS-based emissions model
[Changed] Updated model_number to _v20250701
[Changed] Expanded our vessel coverage to now include 864,738 vessels. Of these, 839,193 (97%) are ‘low-information’ vessels.
[Changed] Improved emissions model by incorporating emissions correction factors for low main engine loads, based on the IMO Fourth GHG Report Table 20 (engines operating at very low loads operate inefficiently, and emit more of certain pollutants)
[Changed] Improved emissions model for SOX and PM by accounting for the fact that starting on January 1, 2020, the IMO required lower sulfur content fuel (0.5%, instead of the higher 2.5% that was typical for HFO prior to 2020). For data
>= 2020-01-01, we therefore apply a new correction factor for SOX and PM to account for this lower sulfur content fuel.[Changed] Improved vessel characteristic model for inferring the main engine power, length, and gross tonnage of low-information vessels
[Changed] Improved vessel characteristic model for inferring the vessel class of low-information vessels
[Changed] Improved vessel characteristic model for inferring the subclass of low-information cargo vessels
[Changed] Developed new vessel characteristic model for inferring the subclass of low-information tanker vessels (i.e., chemical or oil, liquefied gas, or other liquid)
[Changed] Developed new vessel characteristic model for inferring the maximum speed design characteristic of low-information vessels (replacing our old method that simply used average values from Table 81 of the 4th IMO Report).
Dark fleet emissions model
[Changed] Updated model_number to _v20250701
[Changed] Uses latest AIS-broadcasting emissions estimates (AIS model version _v20250701) as the basis for dark emissions estimates
[Changed] Uses an improved matching score for determining whether each S1 vessel detection is broadcasting or non-broadcasting
[Changed] Uses an optimized k-nearest-neighbor value of k for interpolating the dark-to-AIS-broadcasting ratios inside and outside the S1 footprint
February 2025 data delivery
AIS-based emissions model
No changes were made.
Dark fleet emissions model
- [Changed] Updated model_number to _v20250228
- [Changed] Improved filtering of sea ice for Sentinel-1 detections
- [Changed] Improved matching of Sentinel-1 detections to AIS vessels
December 2024 data delivery
Since the September 2024 data delivery, we have made several exciting improvements to our model that we would like to highlight for our December 2024 data delivery.
Improvements to both the AIS-based and dark fleet emissions models include:
Added three new pollutants: We have added PM2.5, PM10, and VOCs as modeled pollutants in our methodology. These pollutants are particularly important to consider when assessing the health and environmental impacts of shipping emissions.
Increased temporal coverage: We now provide monthly data from January 2015 through October 2024 for the AIS-based emissions model, and from January 2016 through October 2024 for the dark fleet model.
Improvements to the AIS-based emissions model include:
Improved vessel classification algorithm: For low information vessels (i.e., those that don’t have known registry information for vessel class), we have developed a new vessel type classification sub-model that can differentiate many vessels that were previously lumped together as an undifferentiated
cargovessel type into the specific categories ofbulk_carrier,container,general,refrigerated, andro_ro. These classes now align with the IMO cargo vessel class types, allowing us to more accurately assign auxiliary engine power, boiler power, and design speed for these vessel classes using the IMO methodology. This new model leverages a random forest that is trained on information on port visit patterns by by over 26,000 vessels with known IMO cargo vessel class types, and allows us to more accurately classify cargo vessel types by looking at the most common IMO known vessel types that use the same ports. The method achieves a classification accuracy of 86%.Improved emissions model for fishing vessels: We have improved our emissions model for fishing vessels by leveraging published relationships that adjust main engine load factors for trawlers and dredgers while they are fishing, and also places limits on main engine load factors for other types of fishing vessels.
Improved estimation of design speed: We have improved our vessel-level design speed estimates by using the a table published in the 4th IMO GHG report that provides design speeds for different vessel types and sizes.
Improved filtering of segment noise: We have improved our filtering of noisy segments to avoid unnecessarily removing vessel activity, which allows us to capture more emissions.
Improvements to the dark fleet emissions model include:
Better noise filtering: The new S1 dataset contains less noise and incorporates features that allow for more reliable filtering of detections. Further, the matching score threshold for determining whether the S1 detection is matched to an AIS-broadcasting vessel has been refined. These updates on the S1 dataset increases our confidence in identifying vessels and preventing the assignment of emissions to non-vessel objects.
Higher resolution vessel size extrapolation: We now use 10 length bins (instead of the previous 2) for extrapolating AIS-based emissions to dark fleet emissions. Bins are estimated separately for both fishing and non-fishing vessels, meaning that monthly dark fleet emissions can now be estimated across 10 different size bins for both fishing and non-fishing values. This allows us to more accurately estimate dark fleet emissions for vessels of different sizes, since the size distributions within each length bin are now more similar between the AIS vessel data and S1 detection data.
Refined method for filling in S1 gaps: Missing dark-to-AIS ratios were updated using a k-nearest-neighbor (KNN) approach instead of simply using a single global ratio, allowing us to assign values based on the closest pixels with available information. This method improves the accuracy of dark emissions estimates, better reflecting spatial and temporal heterogeneity outside the S1 footprint, and addressing gaps within the footprint.
Document overview
This document summarizes the GFW framework for estimating emissions (Figure 5), detailing the data and methods used to develop the AIS-based emissions model and the dark vessel emissions model, along with their validation and discussion.
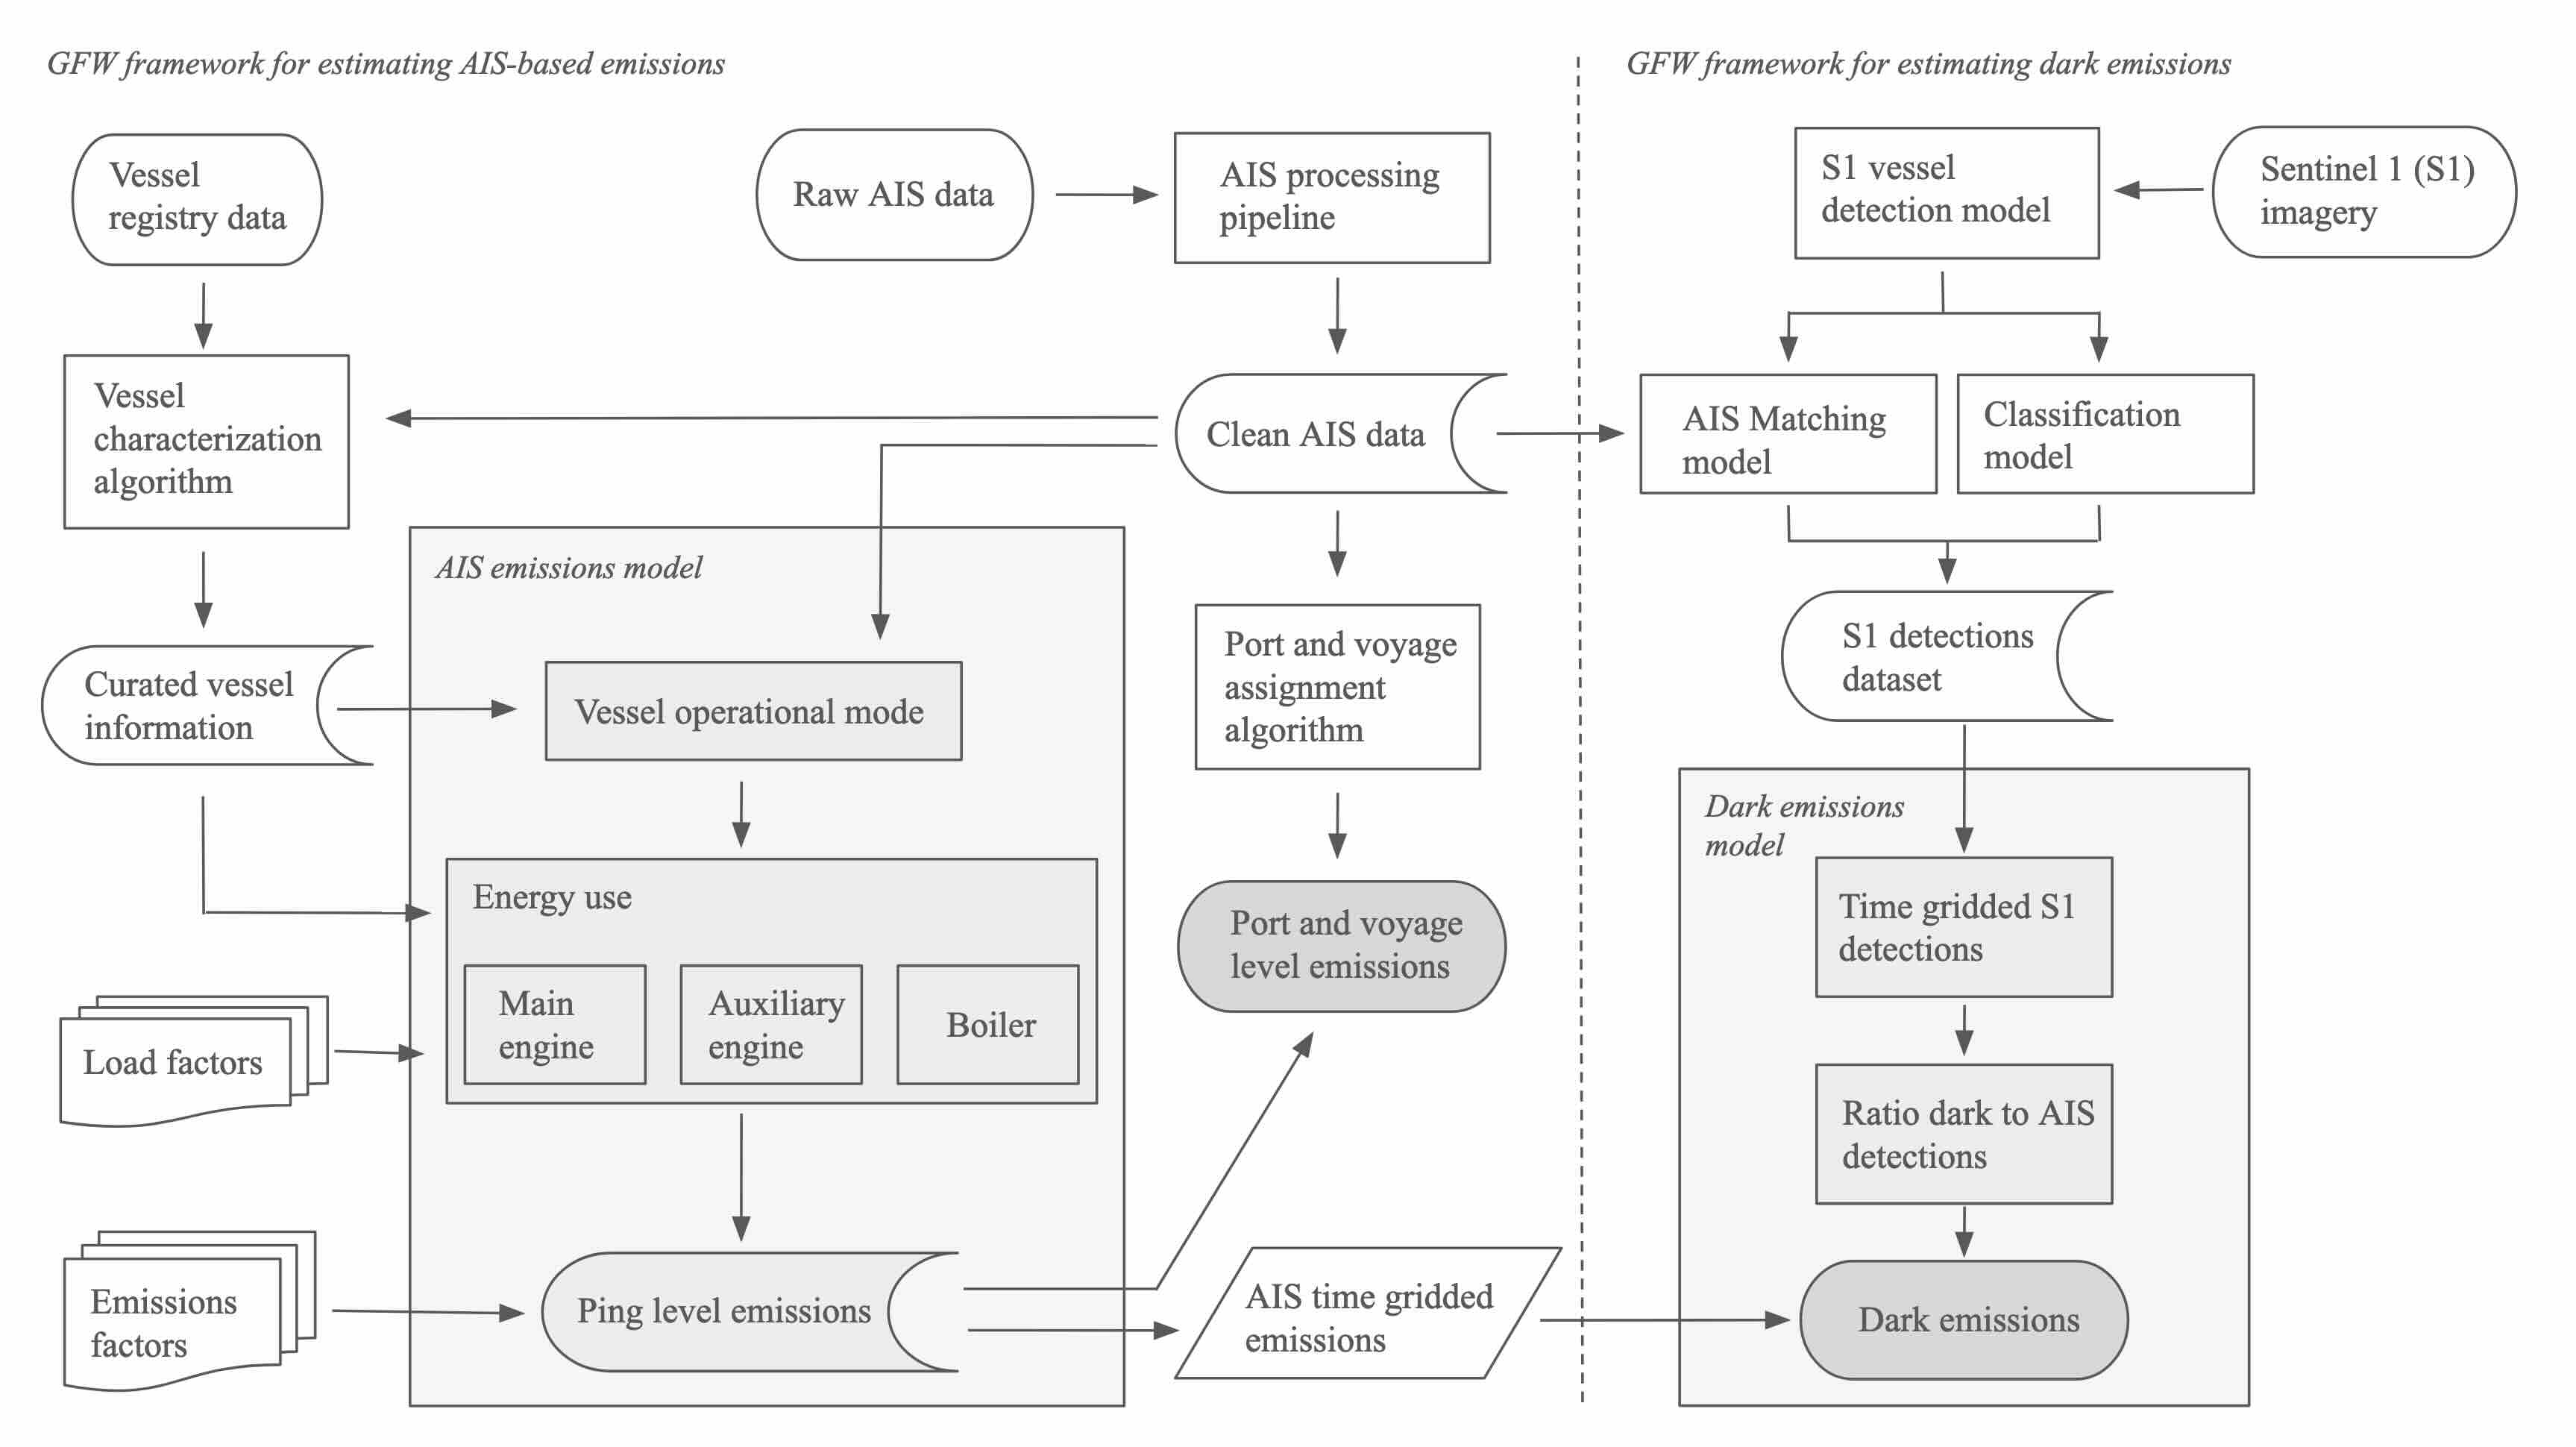
It is composed of the following sections:
AIS-based emissions model
- Methods: Here we fully describe the data and primary model specification used to estimate emissions using the GFW AIS dataset. This describes the data processing pipeline of moving from the raw AIS message data all the way up to voyage-level emission estimates. We also discuss areas of potential future model refinement.
- Results: Here we include high-level results from our AIS-based emissions model.
- Model validation: Here we quantify the performance of our AIS-based emissions model against a number of validation datasets. We quantify performance both for our primary model specification (described in the Methods section) as well as a number of other comparison models that rely on alternative assumptions. The primary model specification is the best performing models across all considered models.
Dark fleet emissions model
- Methods: Here we fully describe the data and model used to estimate emissions for the ‘dark fleet’ using the GFW Sentinel-1 synthetic aperture radar dataset. This describes the entire data processing pipeline and modeling pipeline. We also discuss areas of potential future model refinement.
- Results: Here we include high-level results from our dark fleet emissions model. This includes looking at how much the dark fleet emissions estimates increase global emissions estimates beyond the AIS-based model.
- Model validation: Here we quantify the performance of our dark fleet emissions model using AIS data.
Data delivery
Here we describe the data delivery process for the Climate TRACE and OceanMind teams, including the bucket locations on Google Cloud Storage where each dataset is delivered.
Data processing infrastructure
For this project, we primarily use the R language and an infrastructure based on targets and renv packages to manage our data analysis workflows and ensure reproducibility. The targets package facilitated the creation of an automated pipeline, organizing tasks into a sequence of dependencies that refresh only when their upstream dependencies change, optimizing computational efficiency. The most expensive stages of the AIS pipeline—ping-level emissions, the assignment of pings to voyages and port visits, and the aggregation of partial emissions—are chunked by month, so that new months of data can be processed incrementally without rebuilding the full historical record. Meanwhile, renv allows to manage package dependencies, ensuring that every instance of our analysis can be replicated across different environments. GFW datasets are stored on Google BigQuery, and we access and manipulate those datasets using SQL. All interim datasets are also stored in Google BigQuery. The final output datasets for Climate TRACE and OceanMind, in CSV format that matches their standardized data delivery schemas, are delivered via the Climate TRACE Google Cloud Storage bucket.