```{r}
#| label: fig-map
#| fig-cap: "Spatial distribution of marine protected areas."
#| eval: true
mtcars |>
dplyr::mutate(cyl = factor(cyl)) |>
ggplot2::ggplot(ggplot2::aes(x = wt, y = mpg, color = cyl)) +
ggplot2::geom_point(size = 2.5, alpha = 0.8) +
ggplot2::labs(
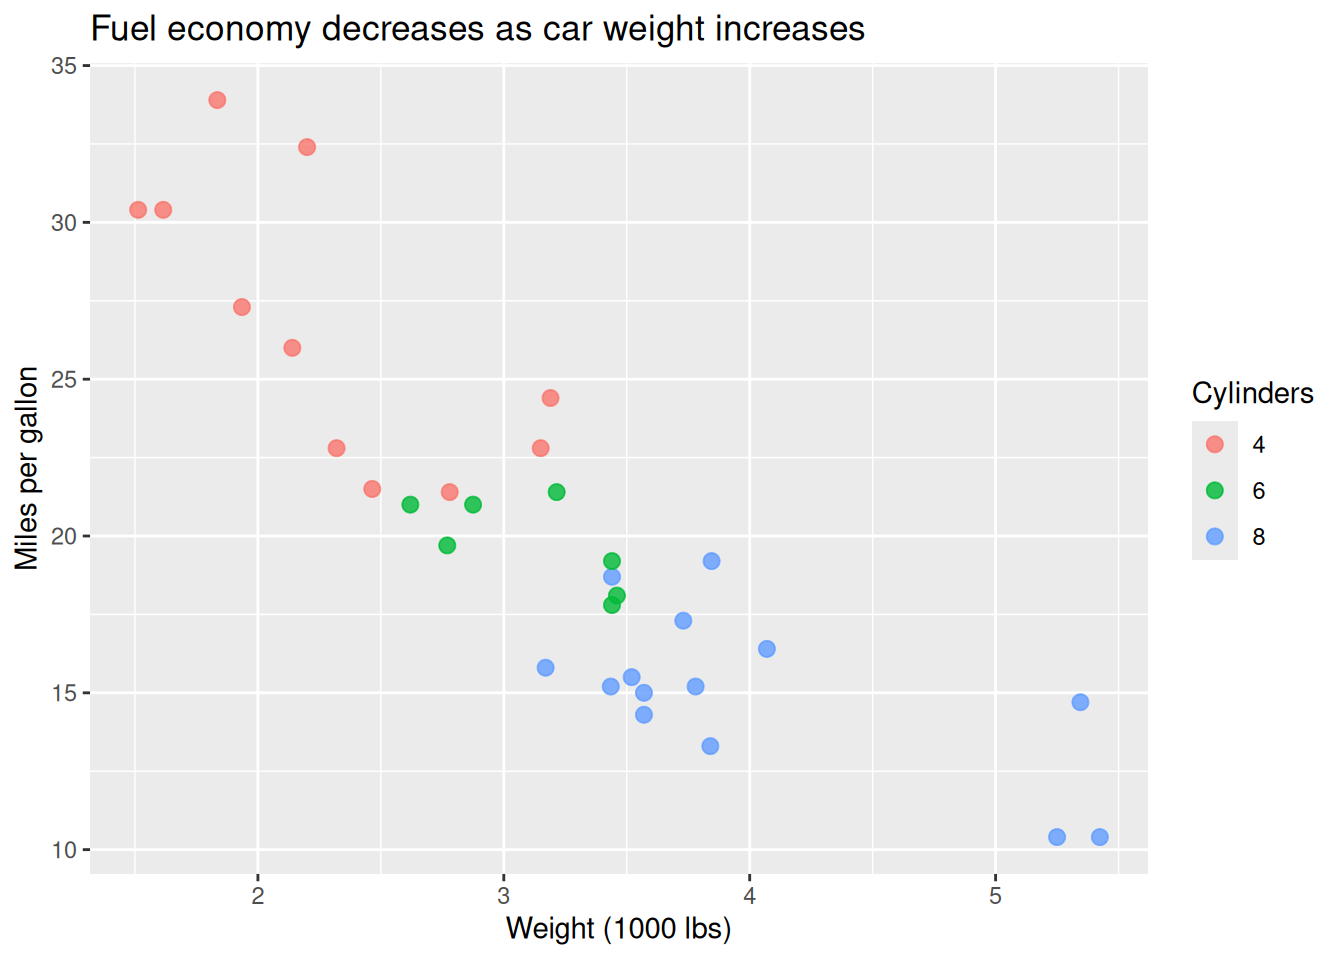
title = "Fuel economy decreases as car weight increases",
x = "Weight (1000 lbs)",
y = "Miles per gallon",
color = "Cylinders"
)
```