---
title: "GHG Emissions from Tankers that Arrive at California Ports"
subtitle: "Preliminary Exploratory Data Analysis"
author: "Environmental Markets Lab (emLab), UCSB"
date: today
date-format: "MMMM D, YYYY"
params:
pull_data: false # Set to true only if you have Global Fishing Watch BigQuery credentials
data_file: "data/tanker_trip_emissions_ending_in_california.csv"
format:
html:
theme: cosmo
toc: true
toc-depth: 3
toc-location: left
code-fold: true
code-summary: "Show code"
code-tools: true
fig-width: 9
fig-height: 6
execute:
warning: false
message: false
---
```{r}
#| label: setup
#| include: false
library(ggplot2)
```
## Overview
This document explores greenhouse gas (GHG) emissions from tankers arriving at California ports using an AIS (Automatic Identification System)-based emissions model developed in collaboration between [Environmental Markets Lab (emLab)](https://emlab.ucsb.edu/) and [Global Fishing Watch (GFW)](https://globalfishingwatch.org/). The model and methodology is described extensively [here](https://emlab-ucsb.github.io/ocean-ghg/).
Tankers arriving at California could be a significant source of maritime emissions, carrying crude oil, petroleum products, liquefied natural gas (LNG), and chemicals to refineries and terminals along the California coast. This report provides a preliminary exploratory data analysis (EDA) of tanker emissions based on the GFW model, covering vessel-level emissions estimates for voyages that end at California ports.
::: {.callout-note}
## Data Access
The underlying data are pulled from Google BigQuery, where emLab and Global Fishing Watch store the vessel-level emissions model. **Only collaborators with GFW BigQuery access** can re-run the SQL queries (see `R/01_pull_bq_data.R`). All other users can reproduce this analysis using the pre-downloaded CSV files in the `data/` folder.
:::
---
## 1. Data Preperation
The following code block connects to Google BigQuery and retrieves tanker voyage and emissions data for vessels arriving at California ports. This section only runs when `params$pull_data` is `TRUE` (i.e., when you have Global Fishing Watch BigQuery credentials configured). This chunk downloads the data and saves it as a CSV file in the `data/` folder, which is then loaded in the next section for analysis. If you do not have BigQuery access, you can skip this section and use the pre-downloaded CSV file.
```{r}
#| label: bq-download data
#| eval: !expr params$pull_data
#| echo: true
# Code to pull data from BigQuery and save as .csv file
# Note: This can only be run by users with access to the BigQuery project and dataset
billing_project <- "emlab-gcp"

# Pull data describing all tanker trips that end in California,
# along with their associated emissions, distance traveled, hours, starting and ending ports, etc
bigrquery::bq_project_query(
  billing_project,
  here::here(
    "sql",
    "tanker_trip_emissions_ending_in_california.sql"
  ) |>
    readr::read_file()
) |>
  bigrquery::bq_table_download(n_max = Inf) |>
  readr::write_csv(here::here(
    params$data_file
  ))
```
## 2. Load Data
Here we load the tanker trip emissions data from the CSV file into R for analysis. This dataset includes vessel-level emissions estimates for voyages that end at California ports, along with associated metadata such as distance traveled, hours at sea, starting and ending ports, and more. The dataset can be directly accessed in the GitHub repo: `r {params$data_file}`.
```{r}
#| label: load-data
countries_of_interest <- c("South Korea", "India")
vessel_class_of_interest <- "tanker.chemical_oil"


tanker_trip_emissions_ending_in_california <- readr::read_csv(
  here::here(params$data_file)
) |>
  dplyr::mutate(
    class_of_interest = ifelse(
      vessel_class == "tanker.chemical_oil",
      TRUE,
      FALSE
    )
  ) |>
  dplyr::mutate(
    from_country = countrycode::countrycode(
      from_country_iso3,
      "iso3c",
      "country.name",
      nomatch = from_country_iso3
    )
  ) |>
  dplyr::mutate(
    country_of_interest = ifelse(
      from_country %in% countries_of_interest,
      TRUE,
      FALSE
    )
  )
```
The primary focus of the analysis is oil tankers, and on voyages departing from `r paste0(countries_of_interest, collapse = " and ")`. We will explore a few figures summarizing all trips ending in California, and then filter to our vessel class and countries of interest for the remainder of the analysis.
The dataset includes `r prettyNum(length(unique(tanker_trip_emissions_ending_in_california$trip_id)),big.mark=',')` unique trips, across `r prettyNum(length(unique(tanker_trip_emissions_ending_in_california$ssvid)),big.mark=',')` unique tanker vessels, from `r prettyNum(length(unique(tanker_trip_emissions_ending_in_california$from_country)),big.mark=',')` countries, that had arrival dates ranging from `r paste0(range(tanker_trip_emissions_ending_in_california$arrival_date),collapse = " to ")`.
---
## 3. Exploratory Data Analysis
In this section, we conduct a preliminary exploratory data analysis (EDA) of the tanker trip emissions data. We will examine the distribution of emissions across voyages, identify key ports and routes, and explore potential trends in the data.
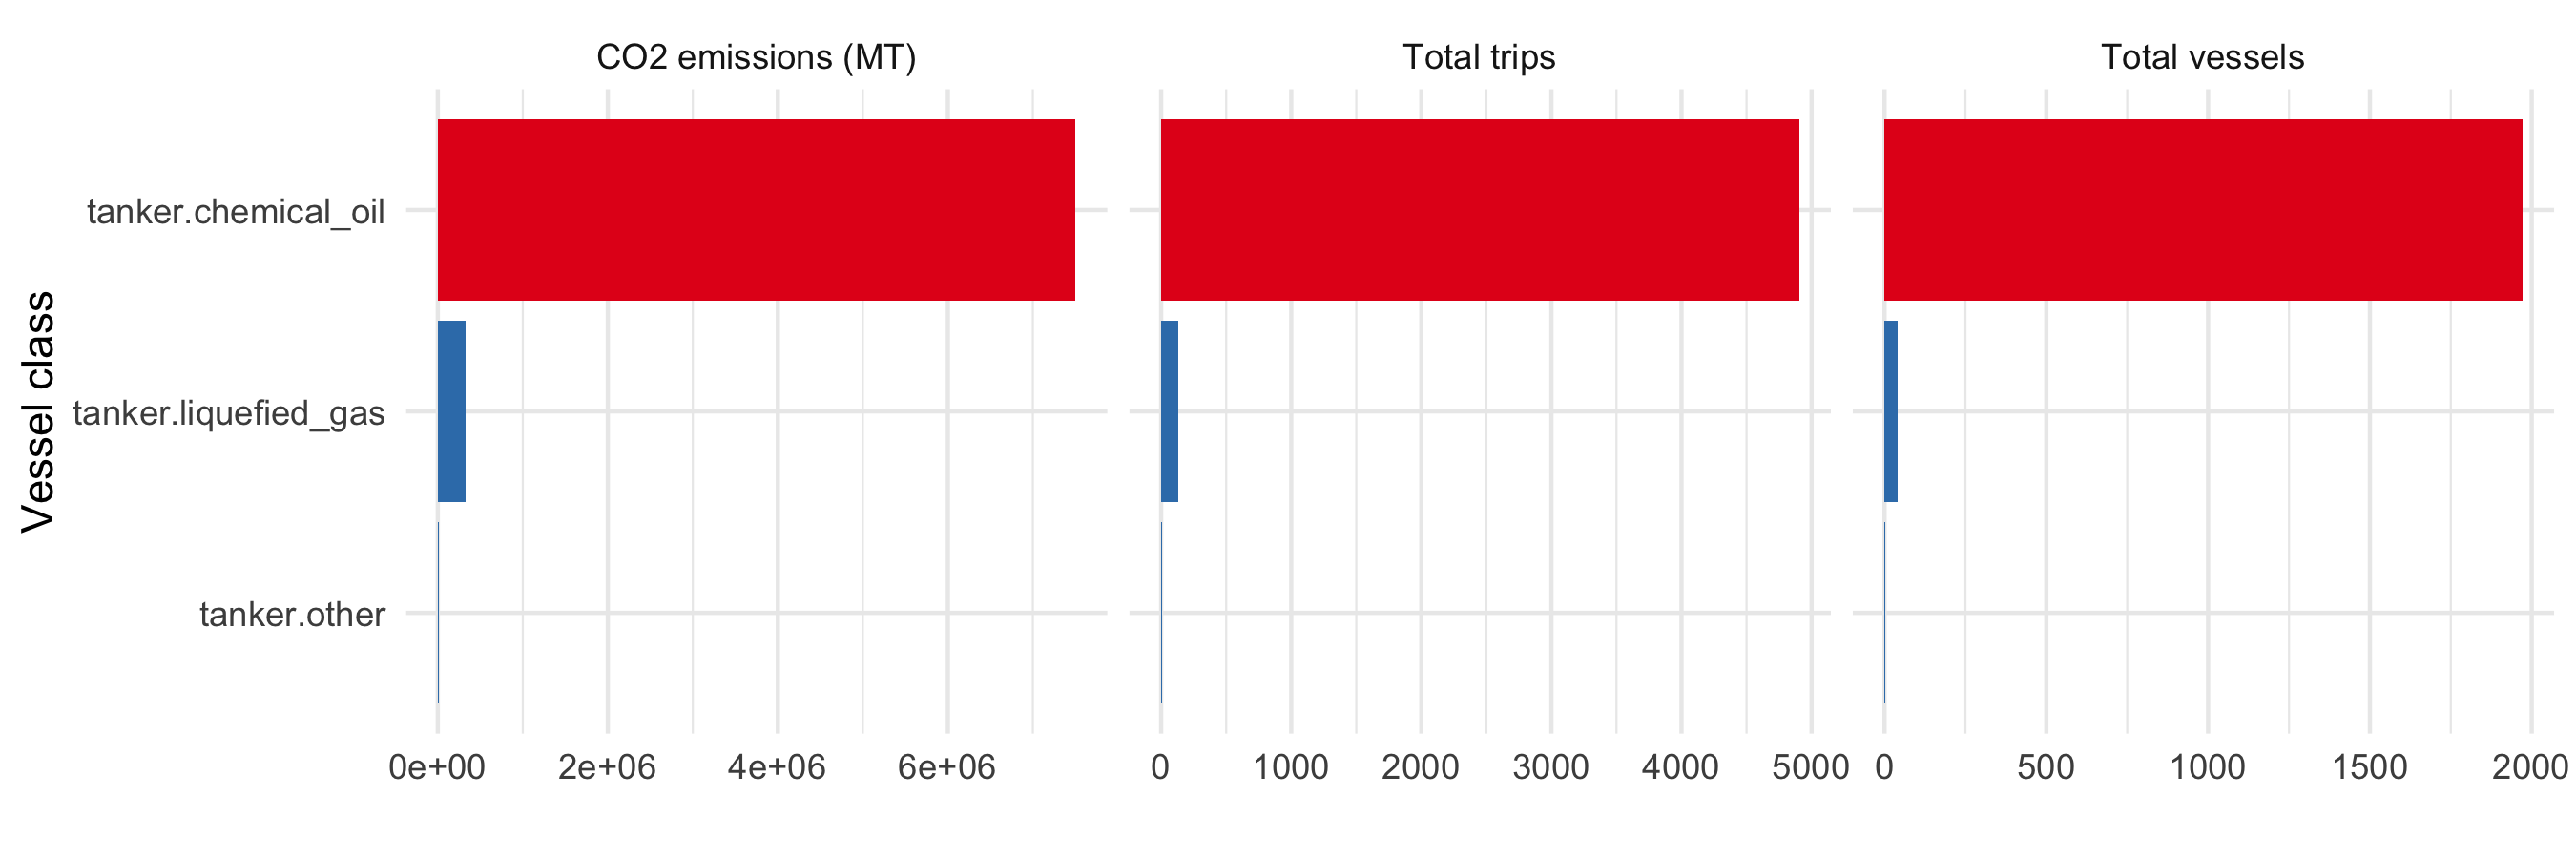
First we look at the total amount of CO2 emissions, number of tanker trips, and number of unique tanker vessels, and for all tanker voyages that end at California ports in our dataset, aggregated by tanker type. The class with by far the most activity is `tanker.chemical_oil`, which includes crude oil tankers, petroleum product tankers, and chemical tankers. We cannot at this time differentiate further between chemica and oil tankers, but we should eventually have this capability later this year. `tanker.liquified_gas` are much less common in voyages ending in California.
For the remainder of the analysis after this figure, we will focus on the `tanker.chemical_oil` class.
```{r}
#| label: fig-vessel-class-summary
#| fig-cap: "Summary of CO2 emissions, tanker trips, and unique tanker vessels, by vessel class, for voyages ending at California ports. This aggregates activity from the entire time period of the dataset (January 2015 through February 2026)."
#| fig-height: 3
tanker_trip_emissions_ending_in_california |>
  dplyr::group_by(vessel_class, class_of_interest) |>
  dplyr::summarise(
    total_trips = dplyr::n_distinct(trip_id),
    total_vessels = dplyr::n_distinct(ssvid),
    emissions_co2_mt = sum(emissions_co2_mt)
  ) |>

  dplyr::arrange(-total_trips) |>
  tidyr::pivot_longer(
    cols = c(total_trips, total_vessels, emissions_co2_mt),
    names_to = "metric",
    values_to = "value"
  ) |>
  dplyr::mutate(
    metric = dplyr::recode(
      metric,
      "emissions_co2_mt" = "CO2 emissions (MT)",
      "total_trips" = "Total trips",
      "total_vessels" = "Total vessels"
    )
  ) |>
  ggplot(aes(
    y = reorder(vessel_class, value),
    x = value,
    fill = class_of_interest
  )) +
  geom_bar(stat = "identity") +
  facet_wrap(~metric, scales = "free_x") +
  theme_minimal() +
  labs(x = "", y = "Vessel class") +
  theme(legend.position = "none") +
  scale_fill_brewer(palette = "Set1", direction = -1)
```
```{r}
#| label: data-country-summary
country_level_data <- tanker_trip_emissions_ending_in_california |>
  dplyr::filter(vessel_class == vessel_class_of_interest) |>
  dplyr::group_by(from_country, country_of_interest) |>
  dplyr::summarise(
    total_trips = dplyr::n_distinct(trip_id),
    total_vessels = dplyr::n_distinct(ssvid),
    emissions_co2_mt = sum(emissions_co2_mt)
  ) |>
  dplyr::arrange(-total_trips) |>
  dplyr::mutate(rank = dplyr::row_number())
```
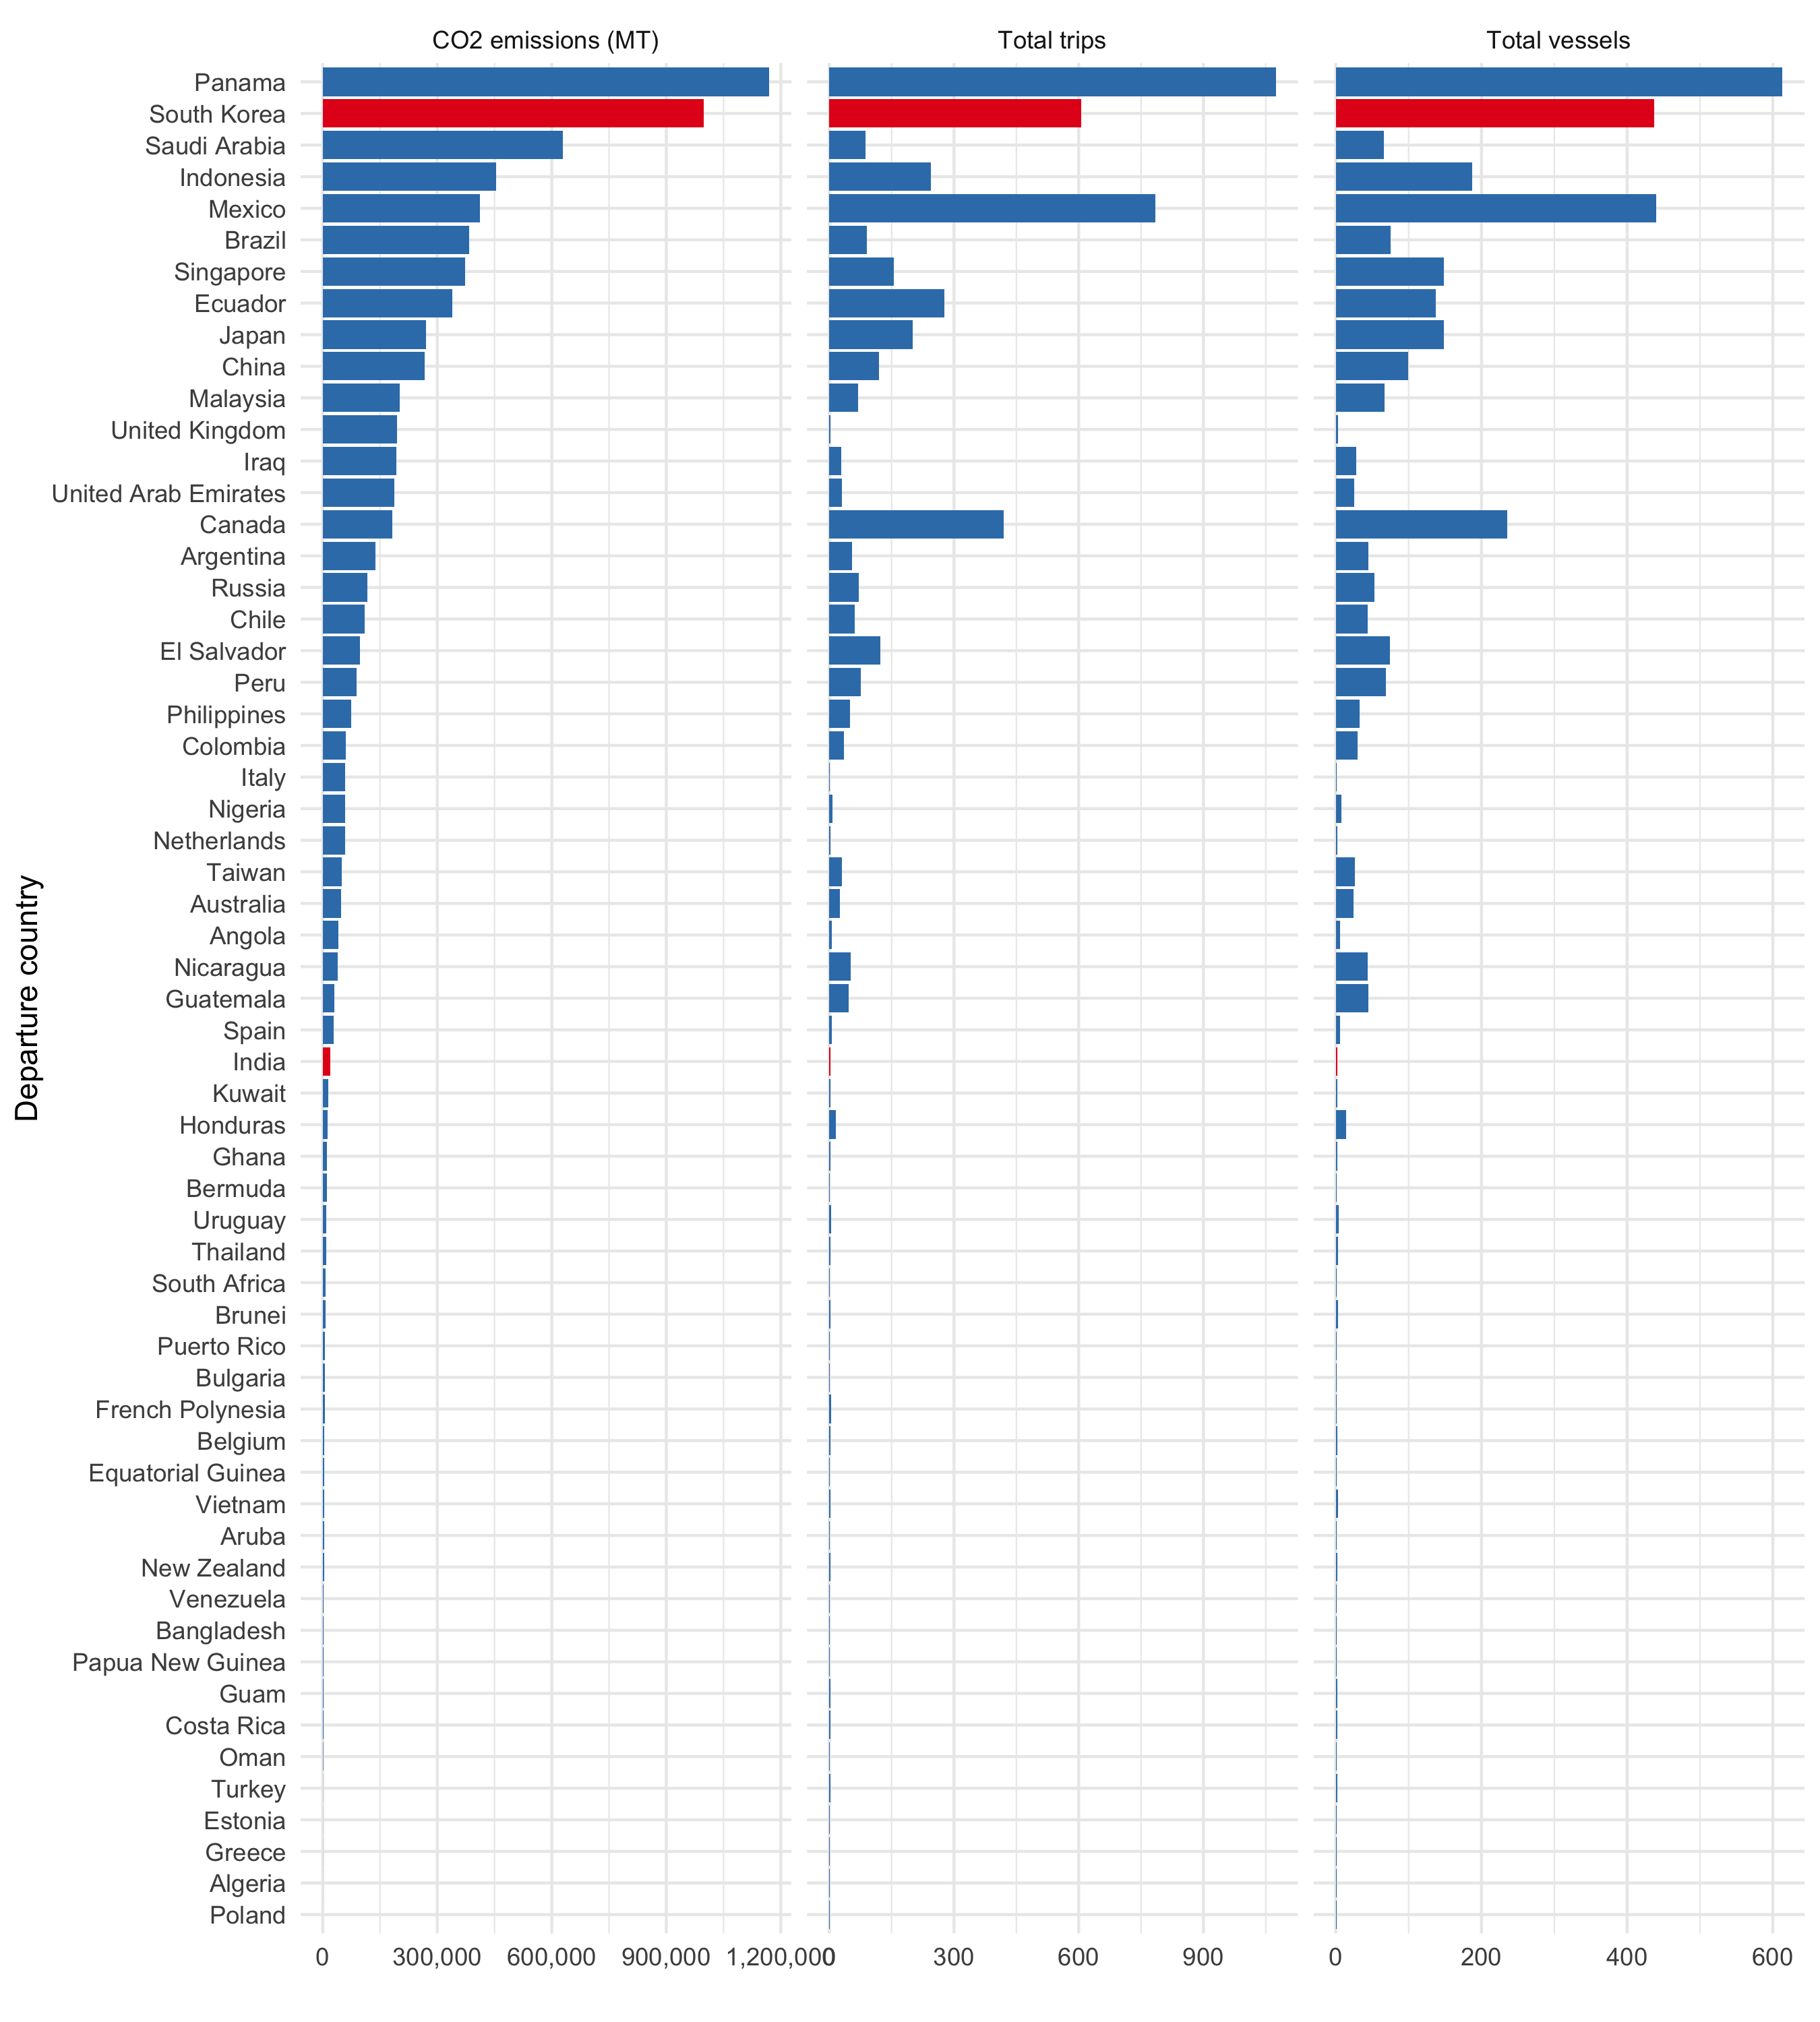
Next we look at the total amount of CO2 emissions, number of tanker trips, and number of unique tanker vessels, and for all chemical and oil tanker voyages that end at California ports in our dataset, aggregated by departure country. In terms of CO2 emissions, our countries of interest, `r country_level_data |> dplyr::filter(country_of_interest) |> dplyr::pull(from_country) |> paste0(collapse = " and ")`, rank `r country_level_data |> dplyr::filter(country_of_interest) |> dplyr::pull(rank) |> paste0(collapse = " and ")` respectively out of `r nrow(country_level_data)` countries with voyages ending in California.
For the remainder of the analysis after this figure, we will focus on voyages departing from our countries of interest, `r country_level_data |> dplyr::filter(country_of_interest) |> dplyr::pull(from_country) |> paste0(collapse = " and ")`.
```{r}
#| label: fig-country-summary
#| fig-cap: "Summary of CO2 emissions, tanker trips, and unique tanker vessels, by departure country, for voyages ending at California ports. This aggregates activity from the entire time period of the dataset (January 2015 through February 2026)."
#| fig-height: 10
country_level_data |>
  tidyr::pivot_longer(
    cols = c(total_trips, total_vessels, emissions_co2_mt),
    names_to = "metric",
    values_to = "value"
  ) |>
  dplyr::mutate(
    metric = dplyr::recode(
      metric,
      "emissions_co2_mt" = "CO2 emissions (MT)",
      "total_trips" = "Total trips",
      "total_vessels" = "Total vessels"
    )
  ) |>
  ggplot(aes(
    y = reorder(from_country, value),
    x = value,
    fill = country_of_interest
  )) +
  geom_bar(stat = "identity") +
  facet_wrap(~metric, scales = "free_x") +
  theme_minimal() +
  labs(x = "", y = "Departure country") +
  theme(legend.position = "none") +
  scale_fill_brewer(palette = "Set1", direction = -1) +
  scale_x_continuous(labels = scales::comma)
```
```{r}
#| label: data-filter
# Now, filter to our countries and vessel class of interest for the remainder of the analysis
tanker_trips_of_interest_emissions_ending_in_california <- tanker_trip_emissions_ending_in_california |>
  dplyr::filter(
    vessel_class == vessel_class_of_interest,
    from_country %in% countries_of_interest
  ) |>
  # Make data spatial, using arrival port lat/lon
  sf::st_as_sf(
    coords = c("arrival_lon", "arrival_lat"),
    crs = 4326, # WGS84 coordinate reference system
    remove = FALSE
  ) # Keep original lat/lon columns
```
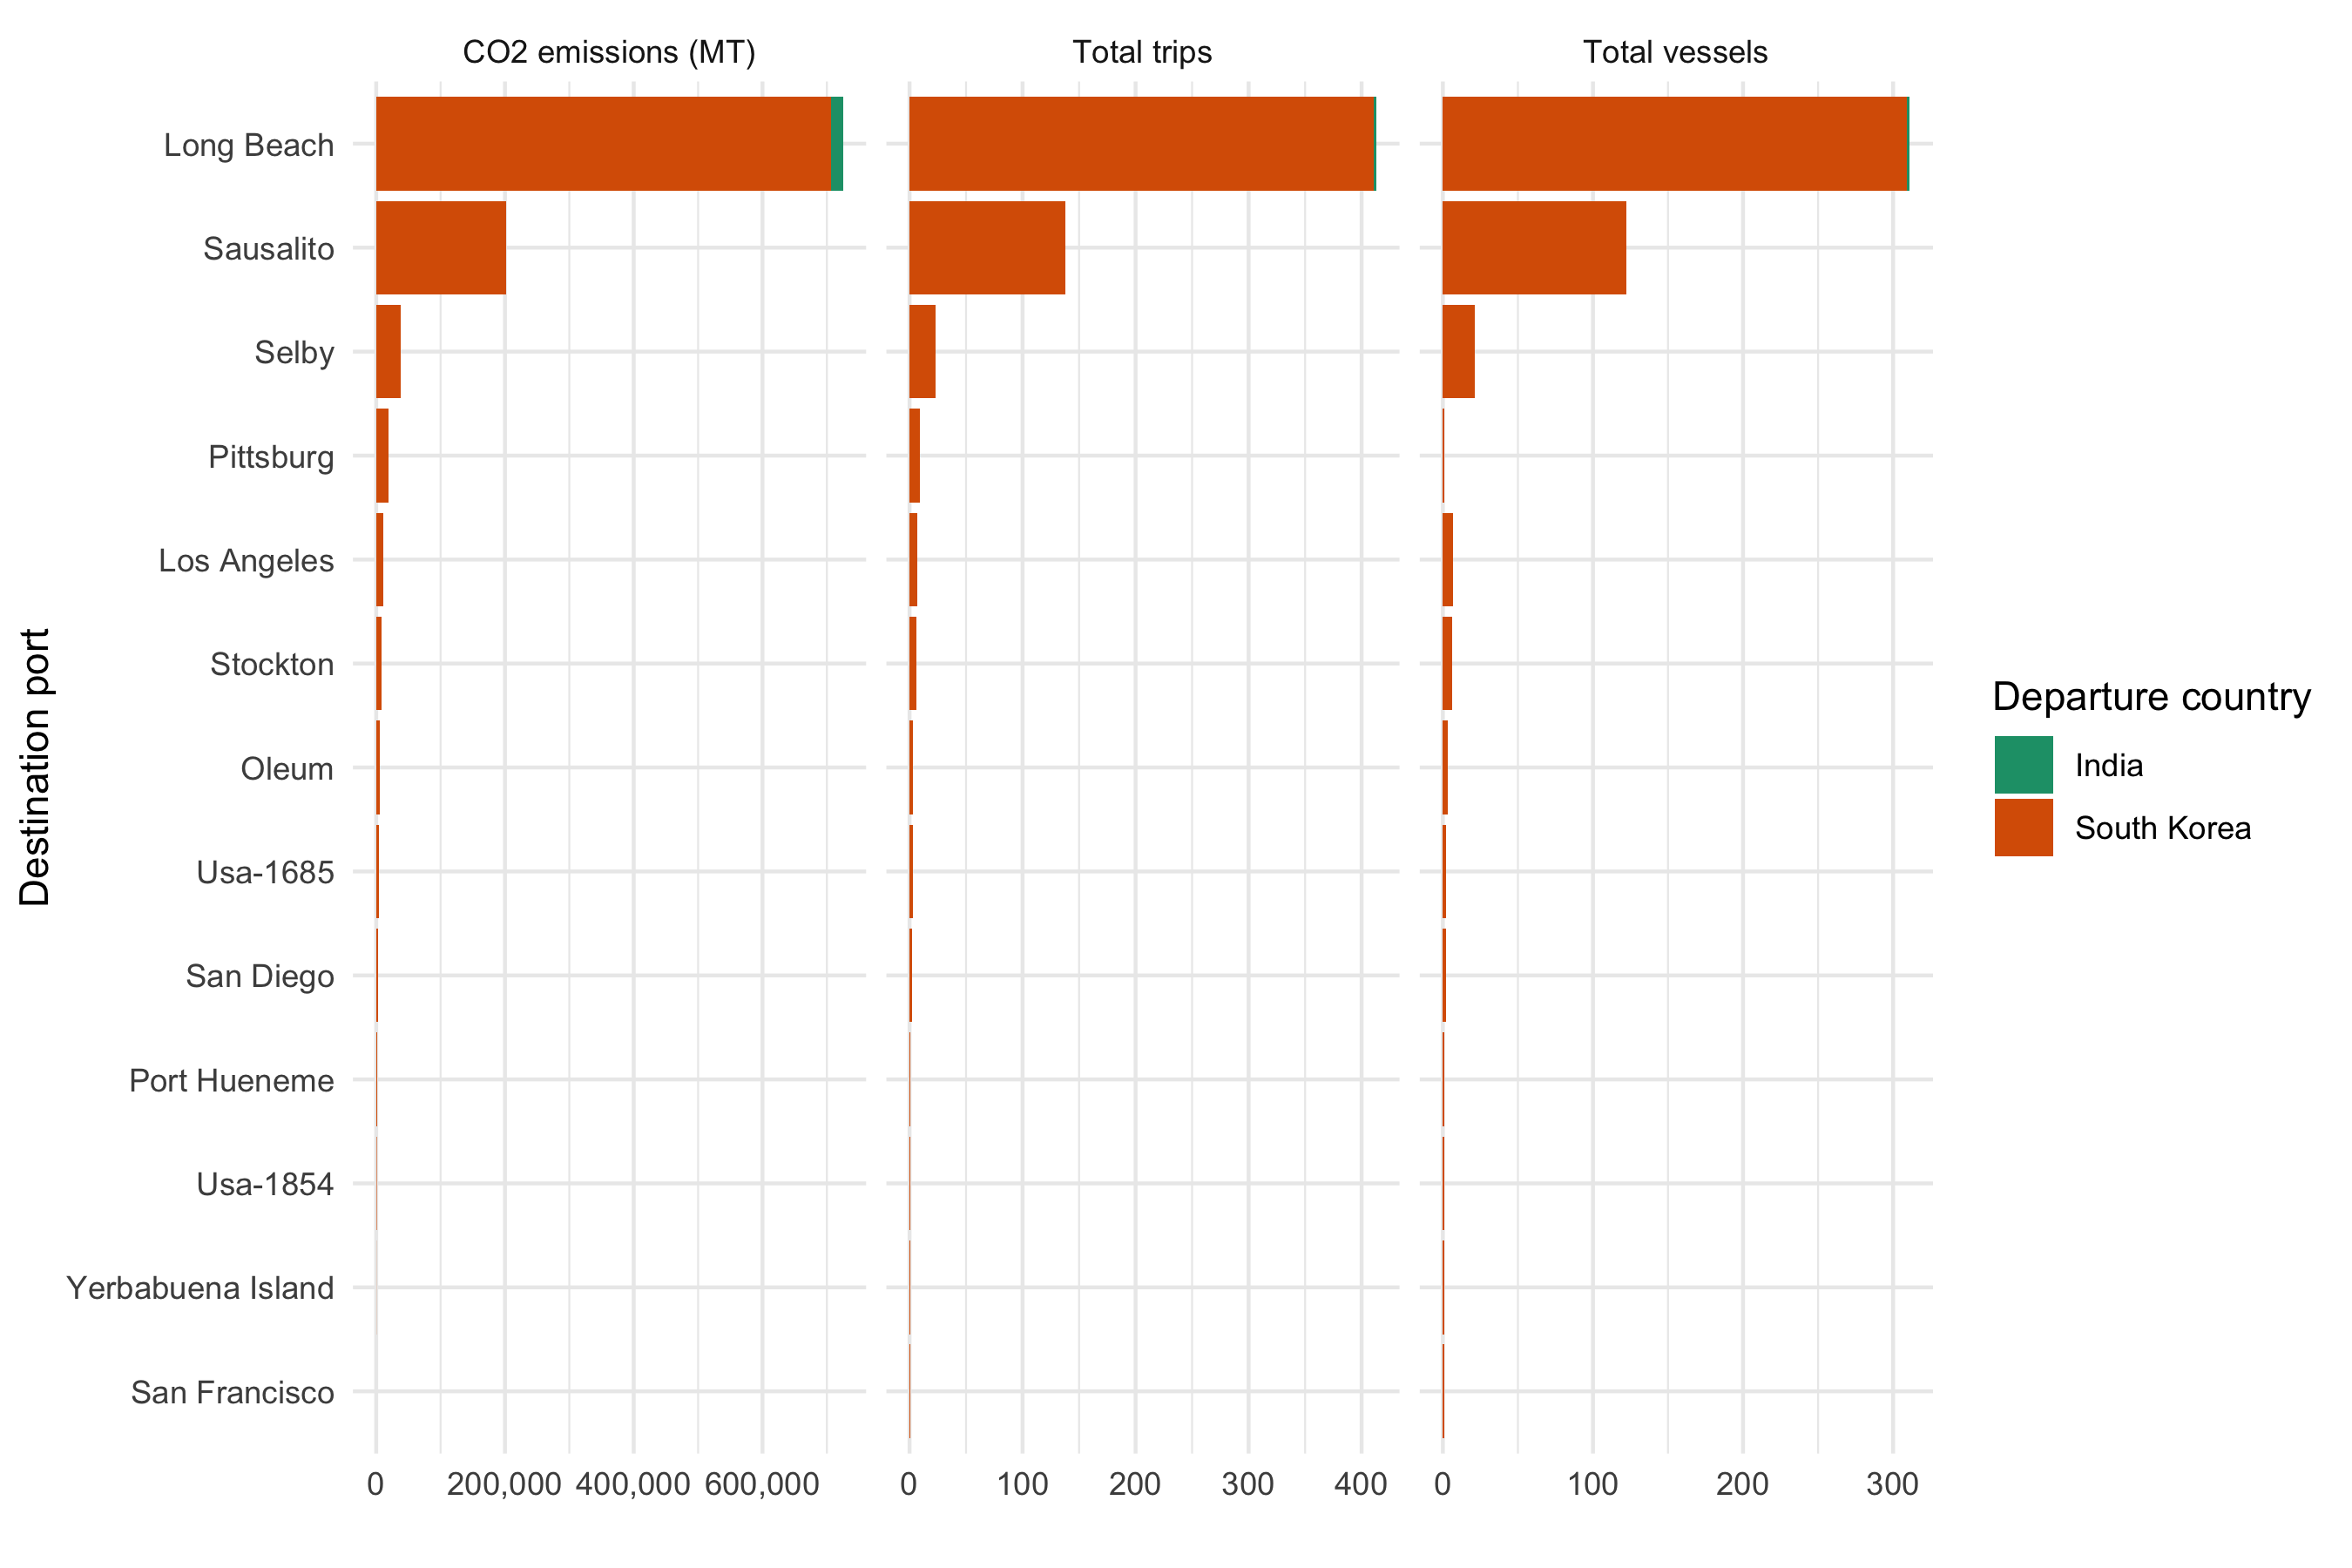
Next we look at the total amount of CO2 emissions, number of tanker trips, and number of unique tanker vessels, for chemical and oil tanker voyages that end at California ports in our dataset, aggregated by departure country and destination port. This allows us to see which California ports are receiving the most tanker traffic and emissions from our countries of interest.
```{r}
#| label: fig-country-port-summary
#| fig-cap: "Summary of CO2 emissions, tanker trips, and unique tanker vessels, by departure country and destination port, for chemical and oil tanker voyages that end at California ports. This aggregates activity from the entire time period of the dataset (January 2015 through February 2026)."
port_level_data <- tanker_trips_of_interest_emissions_ending_in_california |>
  dplyr::mutate(to_port = stringr::str_to_title(to_port)) |>
  dplyr::group_by(to_port, from_country) |>
  dplyr::summarise(
    total_trips = dplyr::n_distinct(trip_id),
    total_vessels = dplyr::n_distinct(ssvid),
    emissions_co2_mt = sum(emissions_co2_mt)
  ) |>
  tidyr::pivot_longer(
    cols = c(total_trips, total_vessels, emissions_co2_mt),
    names_to = "metric",
    values_to = "value"
  ) |>
  dplyr::mutate(
    metric = dplyr::recode(
      metric,
      "emissions_co2_mt" = "CO2 emissions (MT)",
      "total_trips" = "Total trips",
      "total_vessels" = "Total vessels"
    )
  )

port_level_data |>
  ggplot(aes(
    y = reorder(to_port, value),
    x = value,
    fill = from_country
  )) +
  geom_bar(stat = "identity", position = "stack") +
  facet_wrap(~metric, scales = "free_x") +
  theme_minimal() +
  labs(x = "", y = "Destination port", fill = "Departure country") +
  scale_fill_brewer(palette = "Dark2") +
  scale_x_continuous(labels = scales::comma)
```
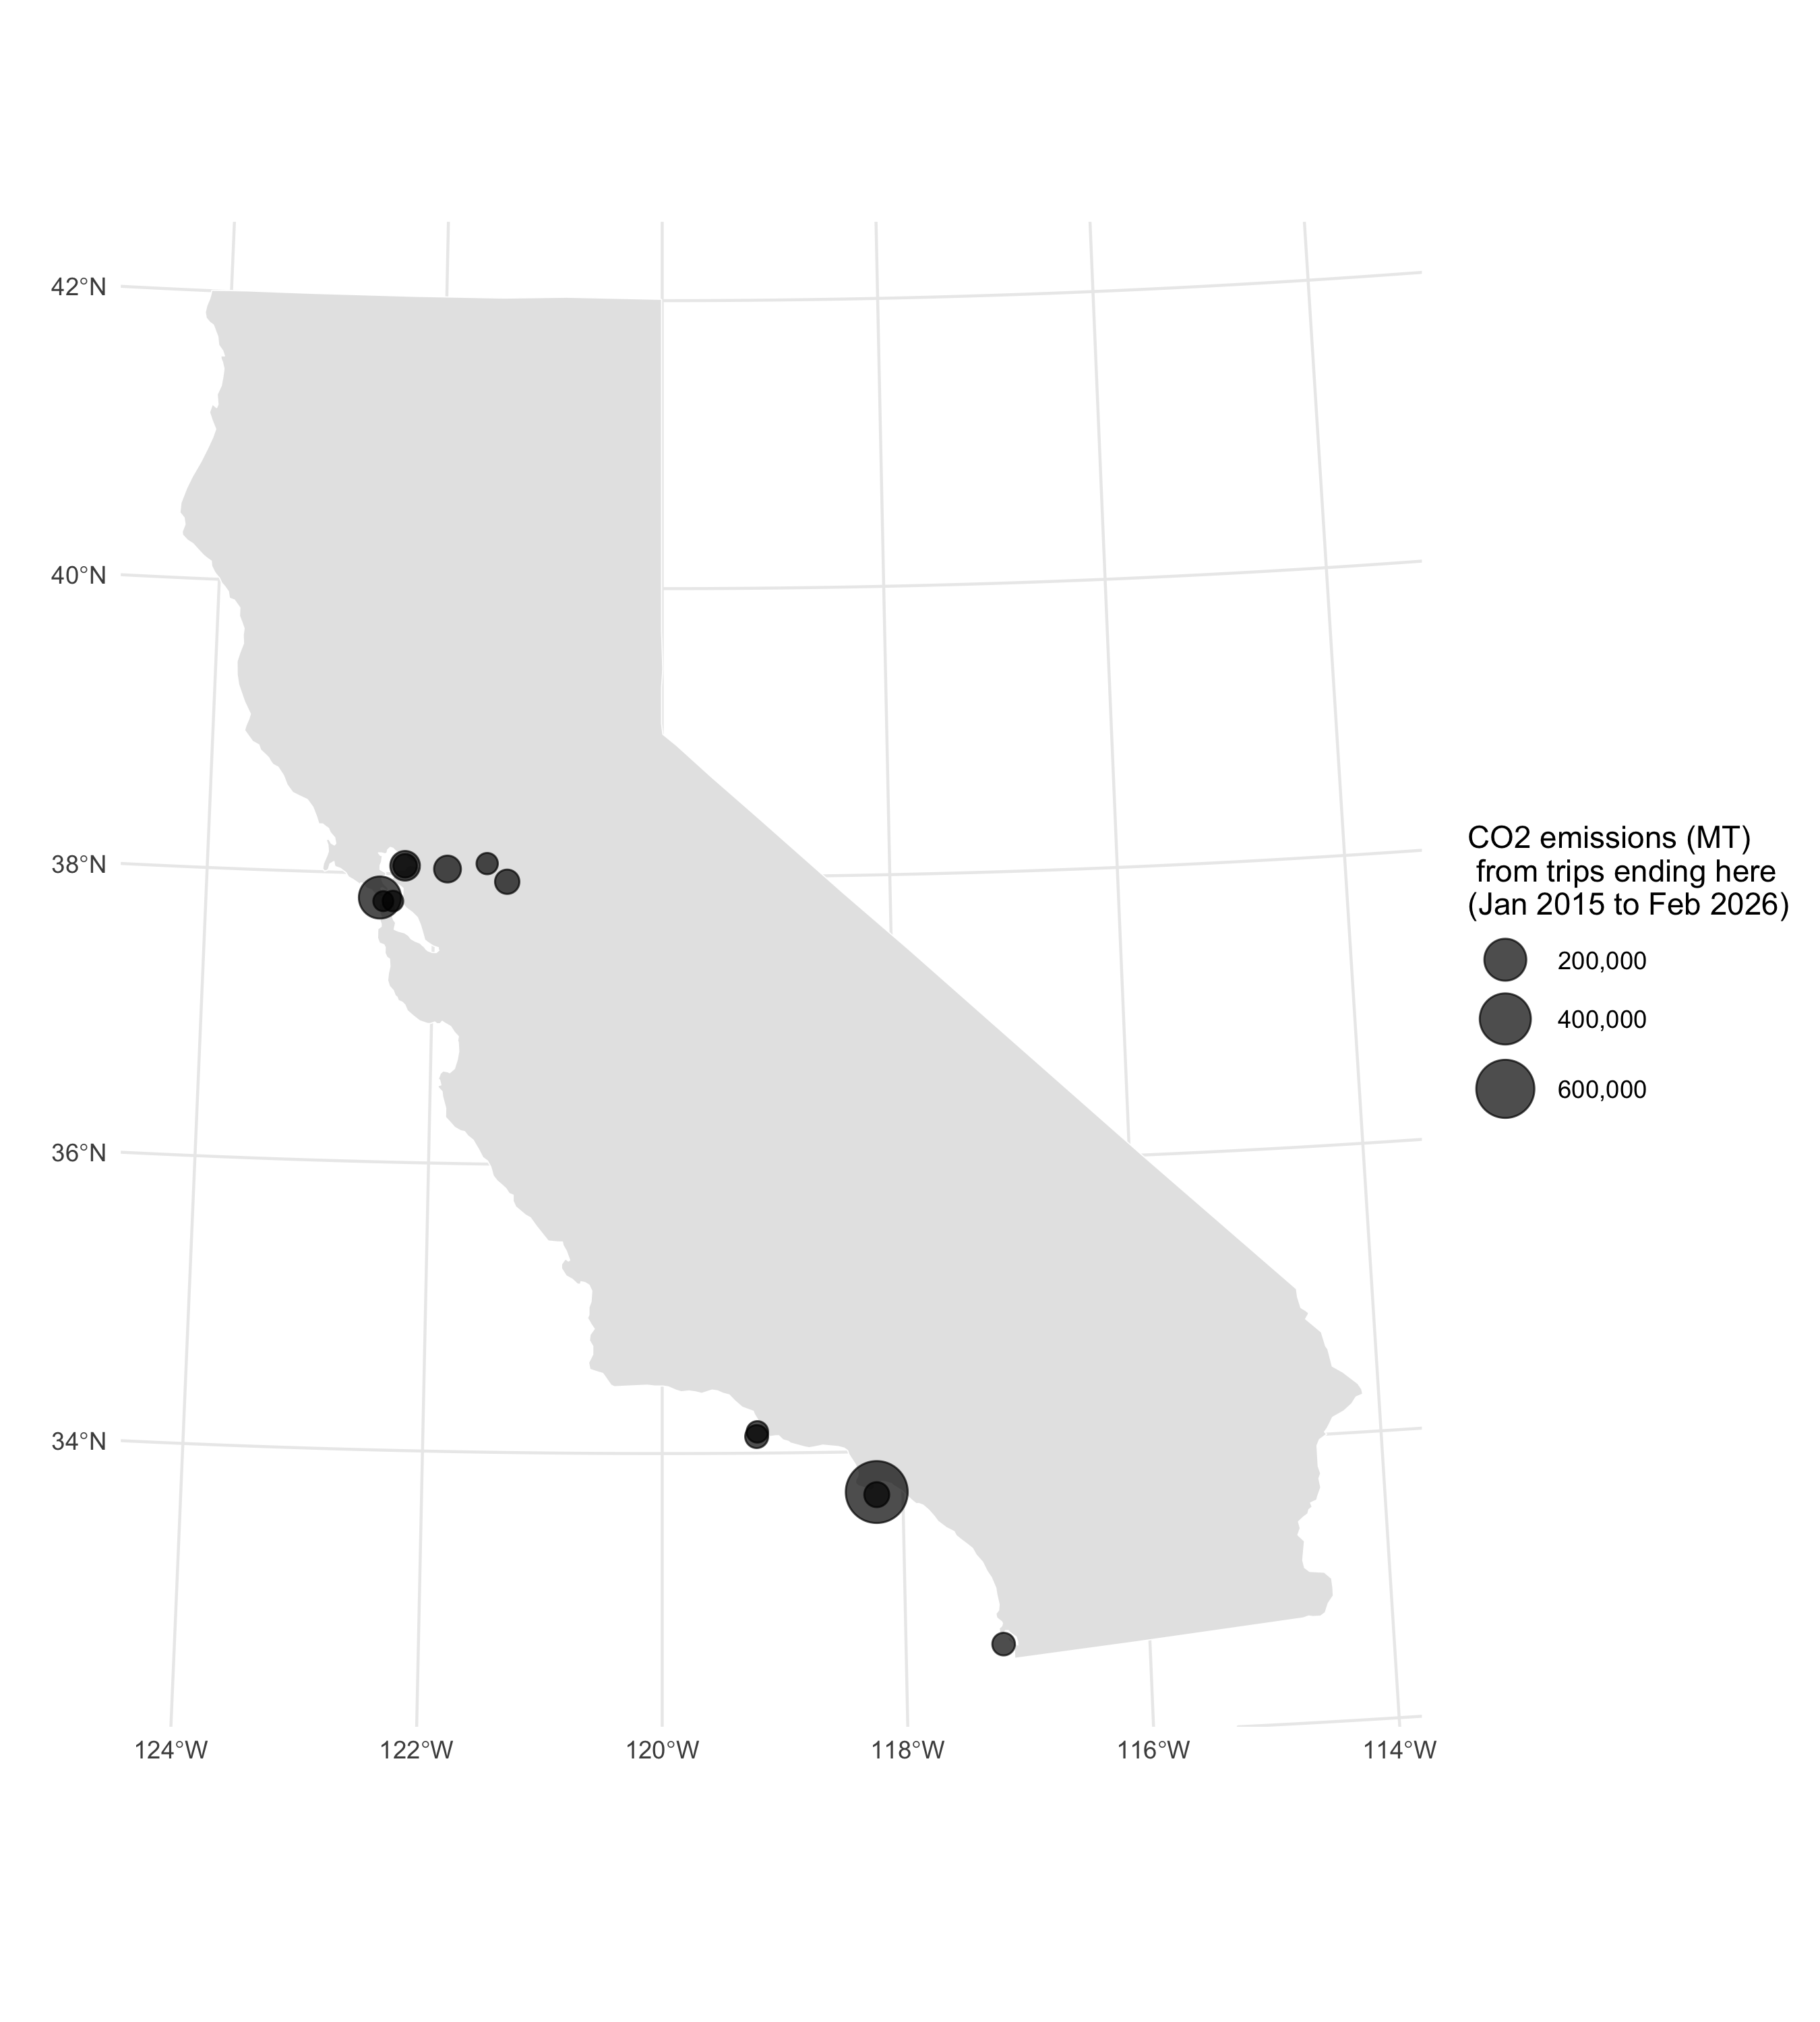
Next we look at a map of the California arrival ports, and how much CO2 emissions are associated with tanker voyages from our countries of interest, `r paste0(countries_of_interest, collapse = " and ")`, that end at each port. The size of the points corresponds to the amount of CO2 emissions (MT) from voyages departing from each country and arriving at each port.
```{r}
#| label: fig-map-ports
#| fig-cap: "Map of California arrival ports for chemical and oil tanker voyages from South Korea and India that end at California ports. The point at each point is sized according to how much CO2 emissions occurred on trips from South Korea and India that ended in this port. This aggregates activity from the entire time period of the dataset (January 2015 through February 2026)."
#| fig-height: 10
california_land_mass <- maps::map(
  "state",
  "california",
  plot = FALSE,
  fill = TRUE
) |>
  sf::st_as_sf() |>
  sf::st_transform(crs = 3310)

ggplot() +
  # add California land mass
  geom_sf(
    data = california_land_mass,
    fill = "gray90",
    color = "white"
  ) +
  geom_sf(
    data = tanker_trips_of_interest_emissions_ending_in_california |>
      dplyr::mutate(to_port = stringr::str_to_title(to_port)) |>
      dplyr::group_by(to_port) |>
      dplyr::summarise(
        emissions_co2_mt = sum(emissions_co2_mt),
        geometry = sf::st_union(geometry)
      ) |> # Combine geometries for all trips to the same port
      sf::st_centroid() |> # Get centroid of each port geometry for plotting
      sf::st_transform(crs = 3310), # Transform to California Albers for better visualization,
    aes(size = emissions_co2_mt),
    alpha = 0.7
  ) +
  theme_minimal() +
  labs(
    x = "",
    y = "",
    color = "Departure country",
    size = "CO2 emissions (MT)\n from trips ending here\n(Jan 2015 to Feb 2026)"
  ) +
  scale_color_brewer(palette = "Dark2") +
  scale_size_continuous(
    range = c(3, 10),
    breaks = scales::pretty_breaks(n = 5),
    labels = scales::comma
  ) +
  theme(legend.position = "right")
```
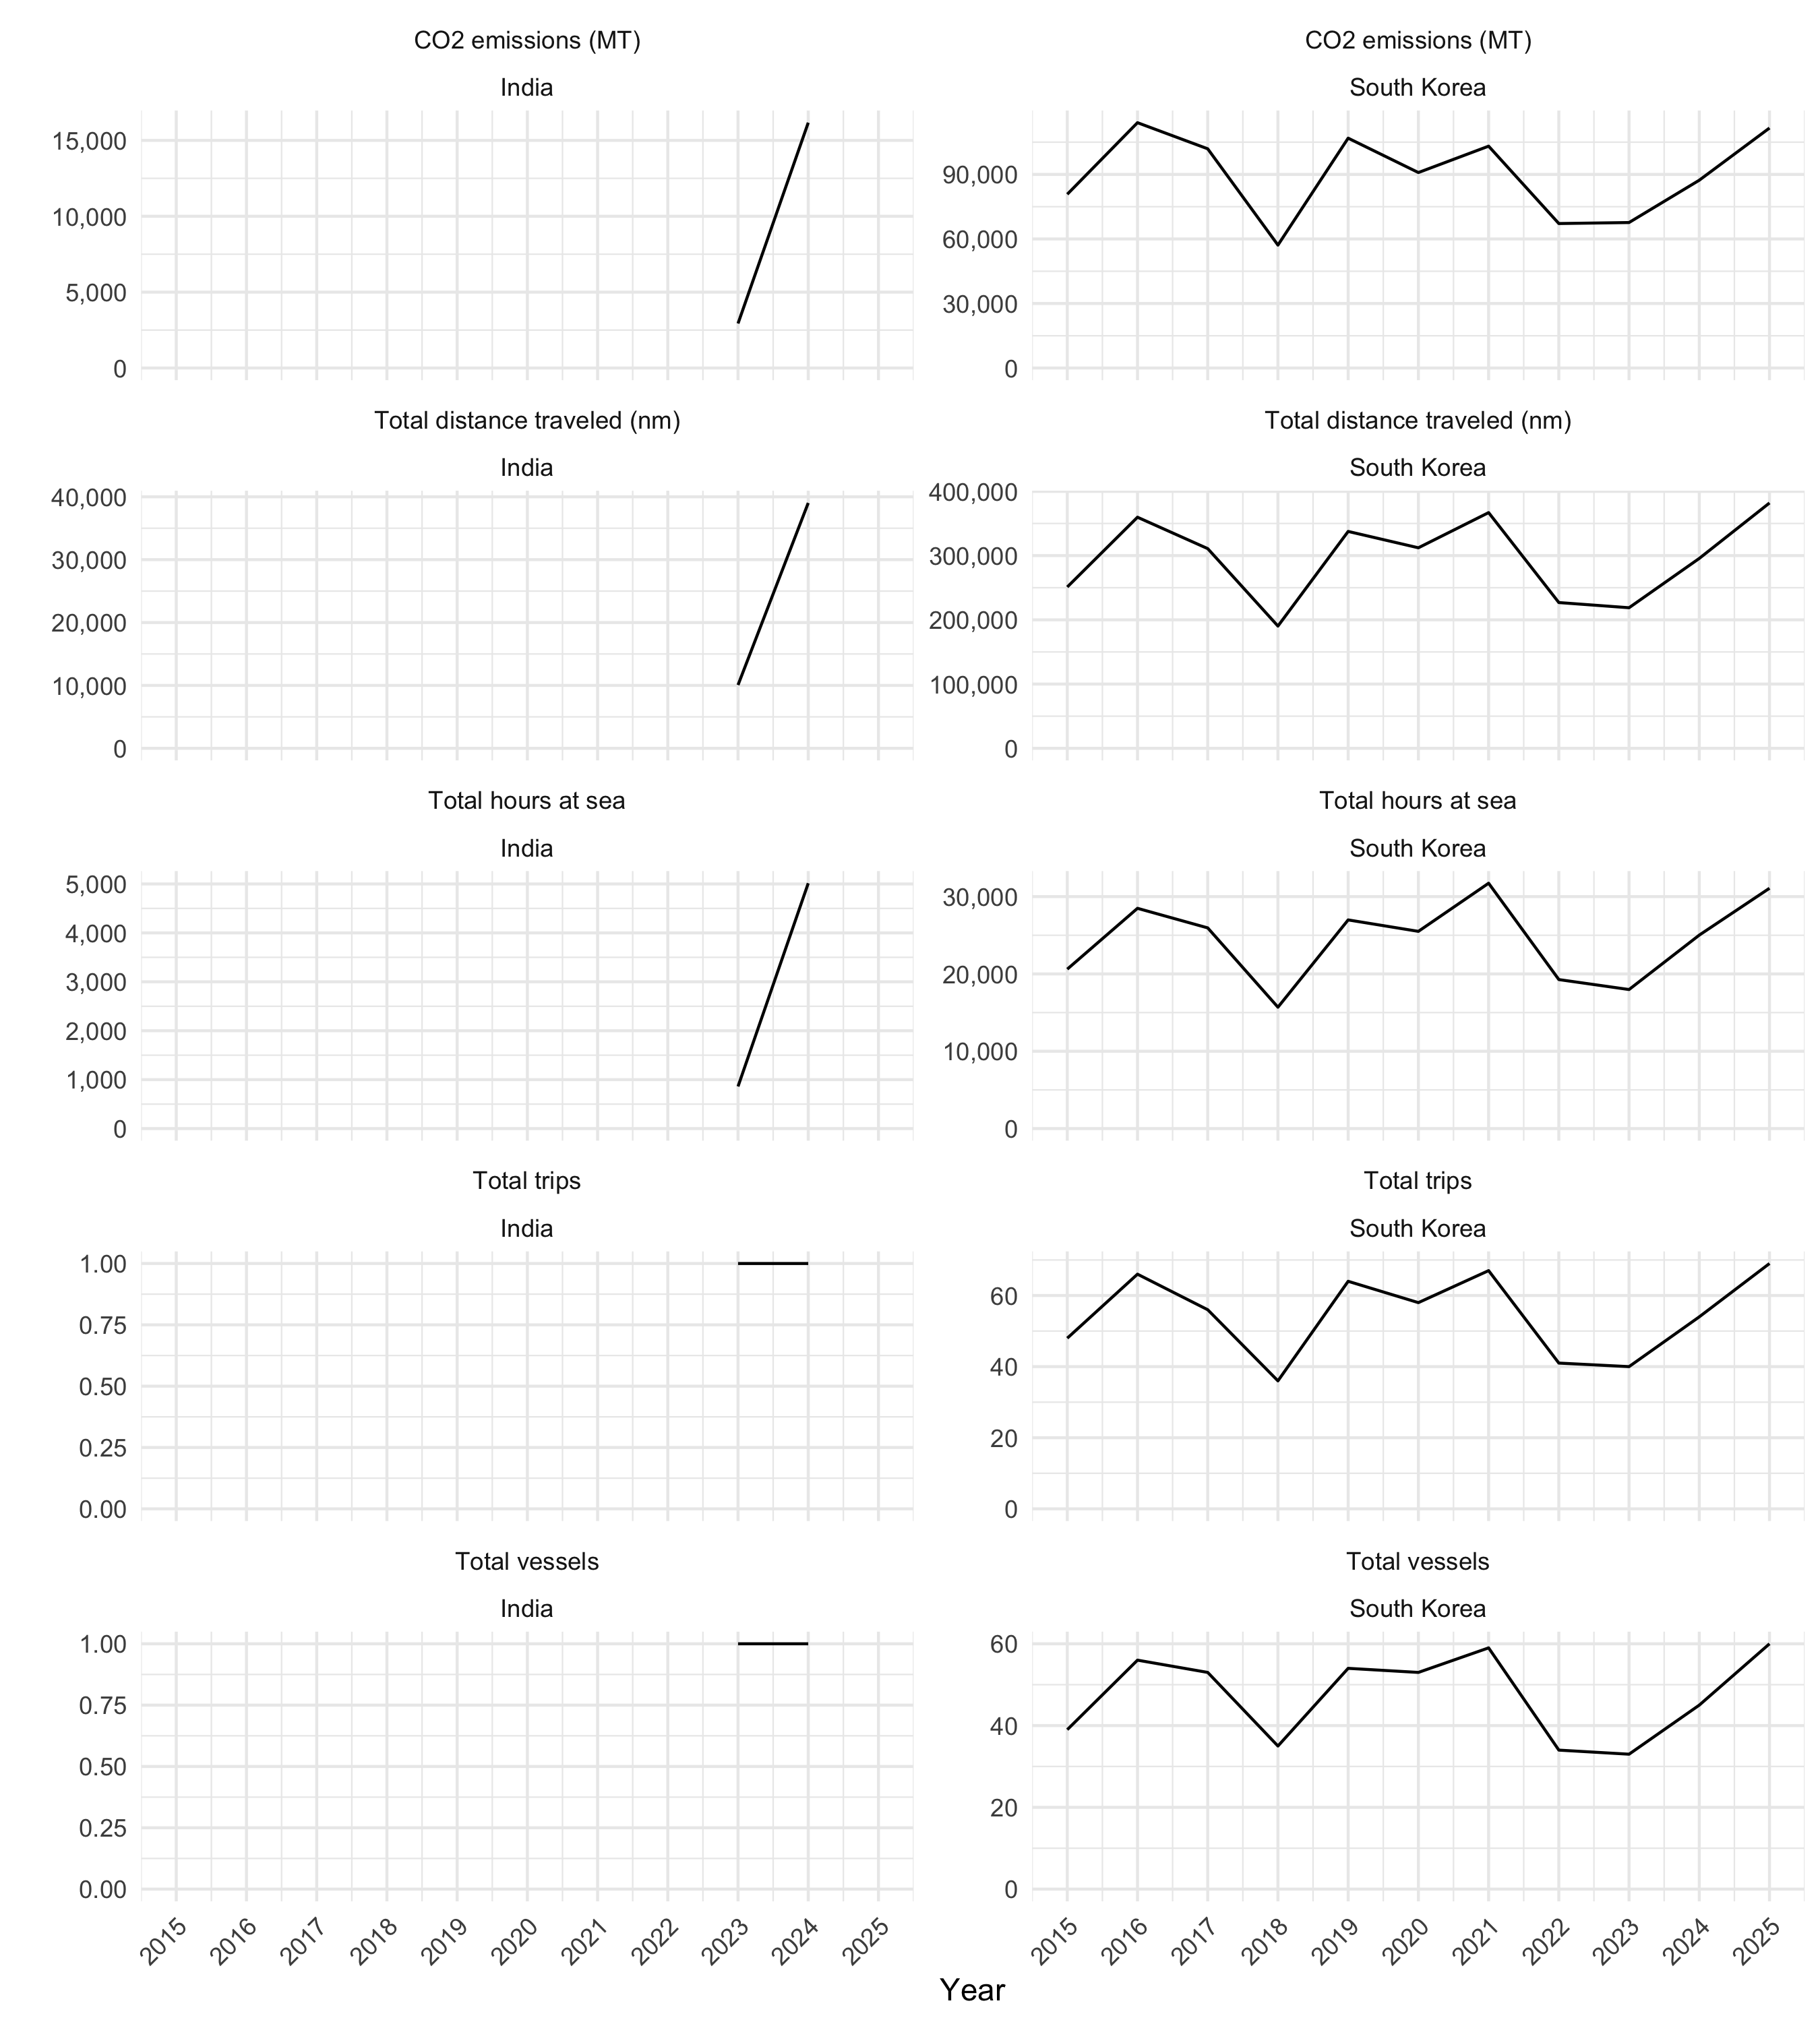
Next we look at a time series plot of number of tanker trips, unique tanker vessels, CO2 emissions, total hours at sea, and total distance traveled (nm), for chemical and oil tanker voyages from South Korea and India that end at California ports. Since 2016 is ongoing, we focus on the 2015-2025 time period. We aggregate by the year during which each voyage arrived in California.
```{r}
#| label: fig-time-series
#| fig-cap: "Annual number of tanker trips, unique tanker vessels, CO2 emissions, total hours at sea, and total distance traveled (nm), for chemical and oil tanker voyages from South Korea and India that end at California ports."
#| fig-height: 10
annual_summary_data <- tanker_trips_of_interest_emissions_ending_in_california |>
  sf::st_drop_geometry() |>
  dplyr::filter(vessel_class == vessel_class_of_interest) |>
  dplyr::group_by(
    year = lubridate::year(arrival_date),
    from_country
  ) |>
  dplyr::summarise(
    total_trips = dplyr::n_distinct(trip_id),
    total_vessels = dplyr::n_distinct(ssvid),
    emissions_co2_mt = sum(emissions_co2_mt),
    hours = sum(hours),
    distance_nm = sum(distance_nm)
  ) |>
  dplyr::filter(year < 2026) |>
  tidyr::pivot_longer(
    cols = c(total_trips, total_vessels, emissions_co2_mt, hours, distance_nm),
    names_to = "metric",
    values_to = "value"
  ) |>
  dplyr::mutate(
    metric = dplyr::recode(
      metric,
      "emissions_co2_mt" = "CO2 emissions (MT)",
      "total_trips" = "Total trips",
      "total_vessels" = "Total vessels",
      "hours" = "Total hours at sea",
      "distance_nm" = "Total distance traveled (nm)"
    )
  )
annual_summary_data |>
  ggplot(aes(x = year, y = value)) +
  geom_line() +
  facet_wrap(metric ~ from_country, scales = "free_y", ncol = 2) +
  theme_minimal() +
  labs(x = "Year", y = "", color = "Departure country") +
  scale_color_brewer(palette = "Set1", direction = -1) +
  scale_y_continuous(labels = scales::comma, limits = c(0, NA)) +
  scale_x_continuous(breaks = seq(2015, 2025, by = 1)) +
  theme(axis.text.x = element_text(angle = 45, hjust = 1))
```
Here we summarize this annual data in a table
```{r}
#| label: tbl-time-series
#| tbl-cap: "Annual number of tanker trips, unique tanker vessels, CO2 emissions, total hours at sea, and total distance traveled (nm), for chemical and oil tanker voyages from South Korea and India that end at California ports."
annual_summary_data |>
  dplyr::mutate(value = round(value) |> prettyNum(big.mark = ",")) |>
  tidyr::pivot_wider(names_from = metric, values_from = value) |>
  dplyr::arrange(from_country, year) |>
  knitr::kable()
```